Track weekly sales, engagement behaviors, and platform performance across Amazon, eBay, Walmart, and Etsy — all in one powerful Excel dashboard.
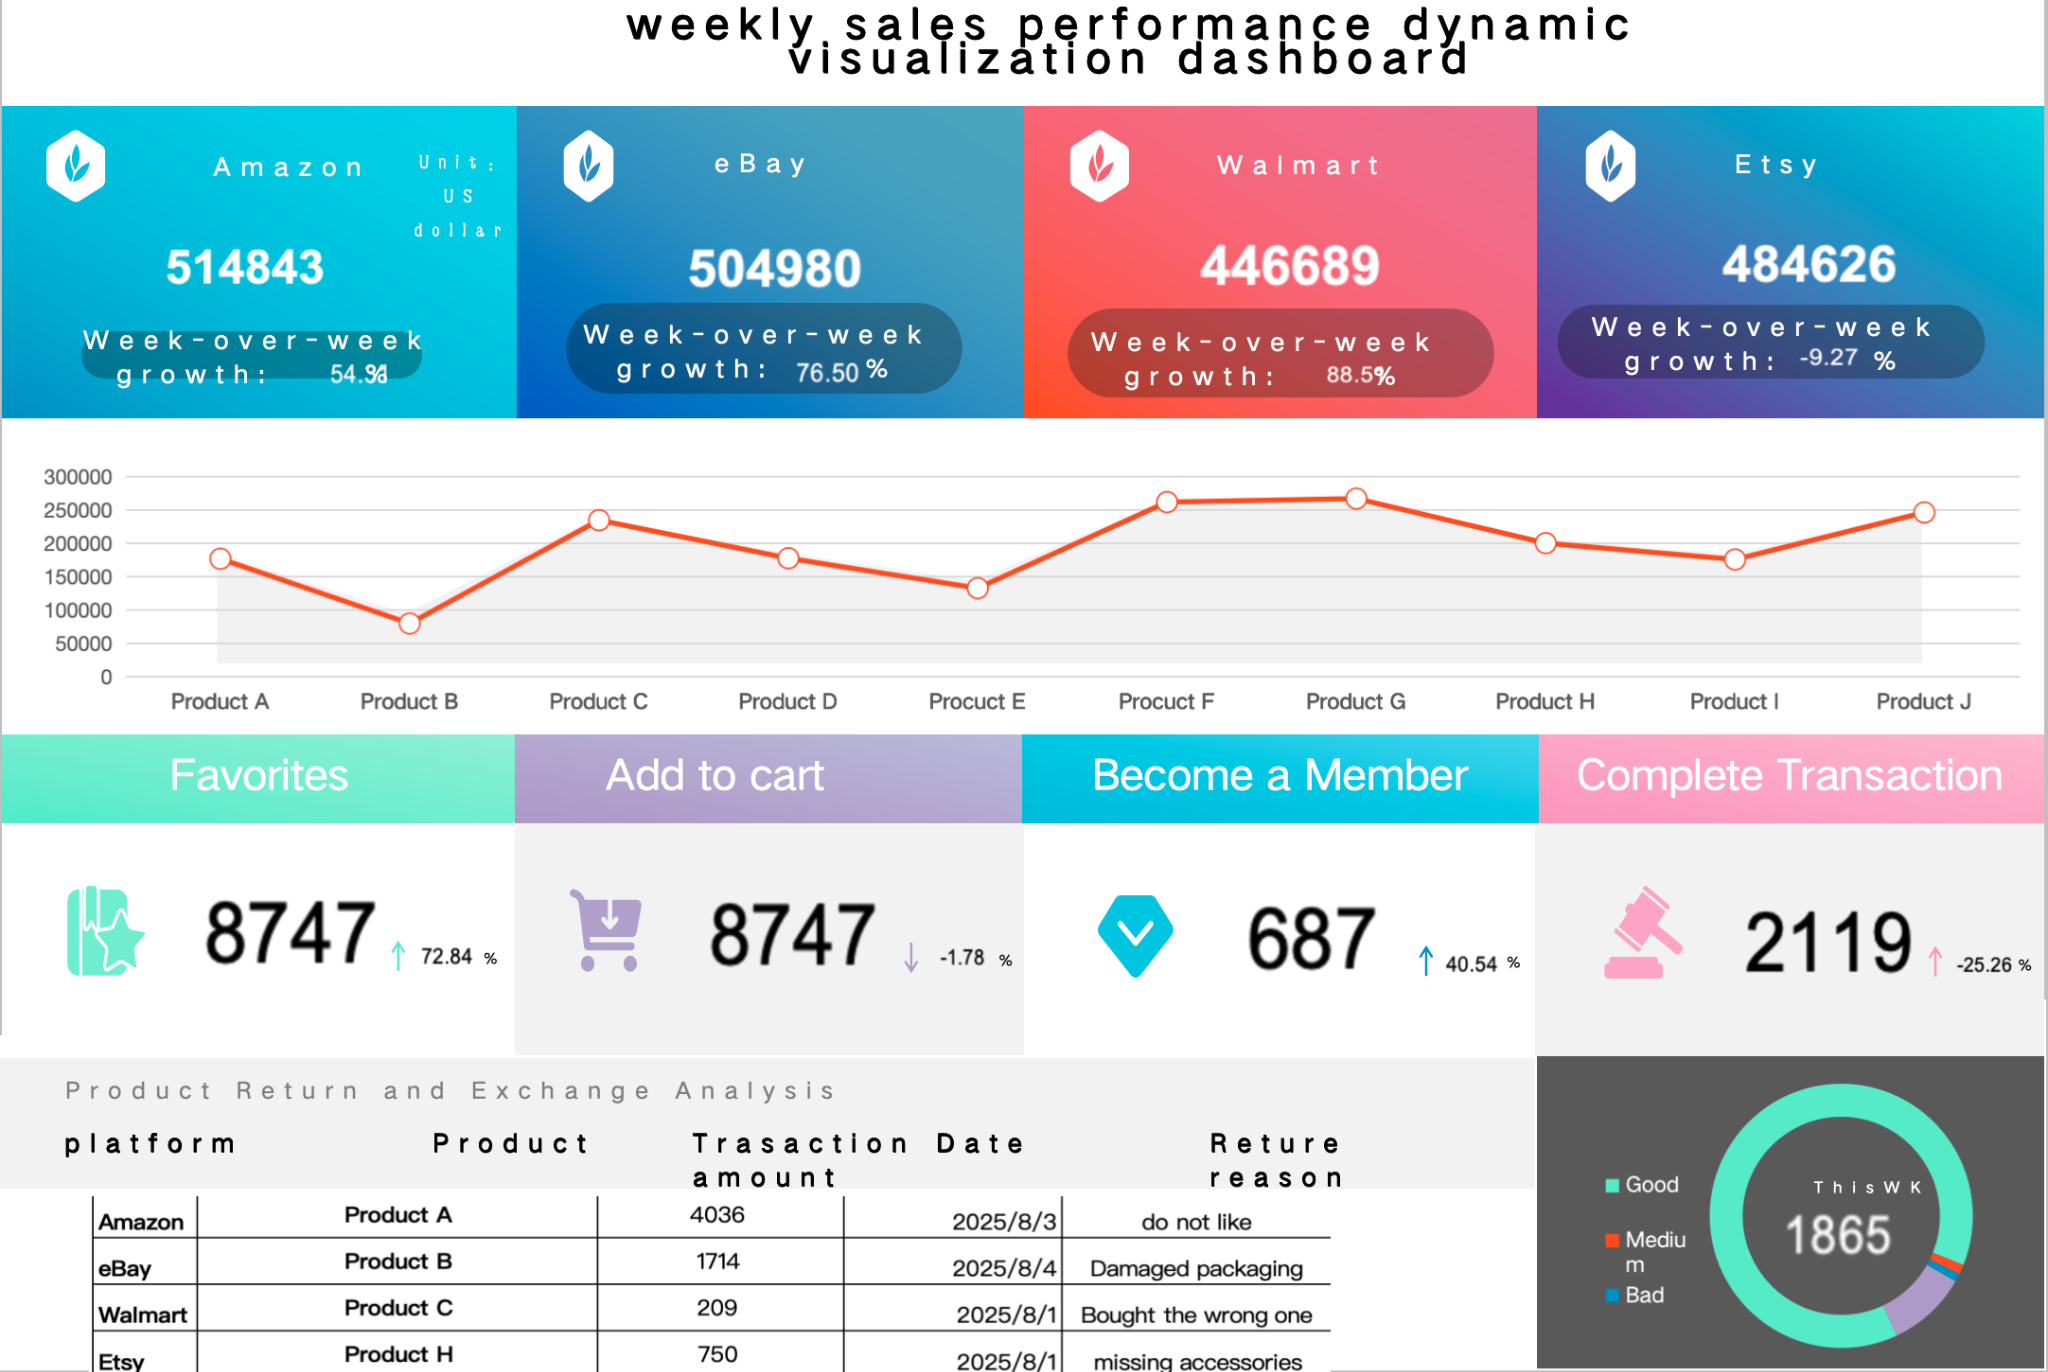
The Weekly Sales Performance Dynamic Dashboard is a high-impact Excel template built for multi-platform eCommerce sellers and performance analysts. It provides a dynamic, visual snapshot of weekly KPIs across major marketplaces, including Amazon, eBay, Walmart, and Etsy.
With visually striking charts, this dashboard empowers you to analyze revenue trends, user behavior (Favorites, Add-to-Cart, Memberships, Transactions), and return reasons in real time — perfect for agile business decisions.
Key Features:
-
📊 Platform Overview Cards – Compare weekly sales and week-over-week growth across four platforms
-
📈 Product Sales Trend Line Chart – Visualize top 10 products’ weekly performance
-
💡 User Engagement Tracker – Track behavior stats:
-
Favorites
-
Add to Cart
-
Member Sign-Ups
-
Transactions Completed
-
-
🔄 Returns and Refunds Table – With product, date, reason, and amount
-
📍 Customer Feedback Pie Chart – Categorize satisfaction (Good / Medium / Bad)
-
🚀 Fully automated Excel dashboard, editable and dynamic
-
🔧 No macros or plugins required — 100% Excel native
评价
目前还没有评价