Track and compare individual sales performance across quarters with this all-in-one Excel dashboard — featuring tables, rankings, pie charts, and dynamic bar graphs.
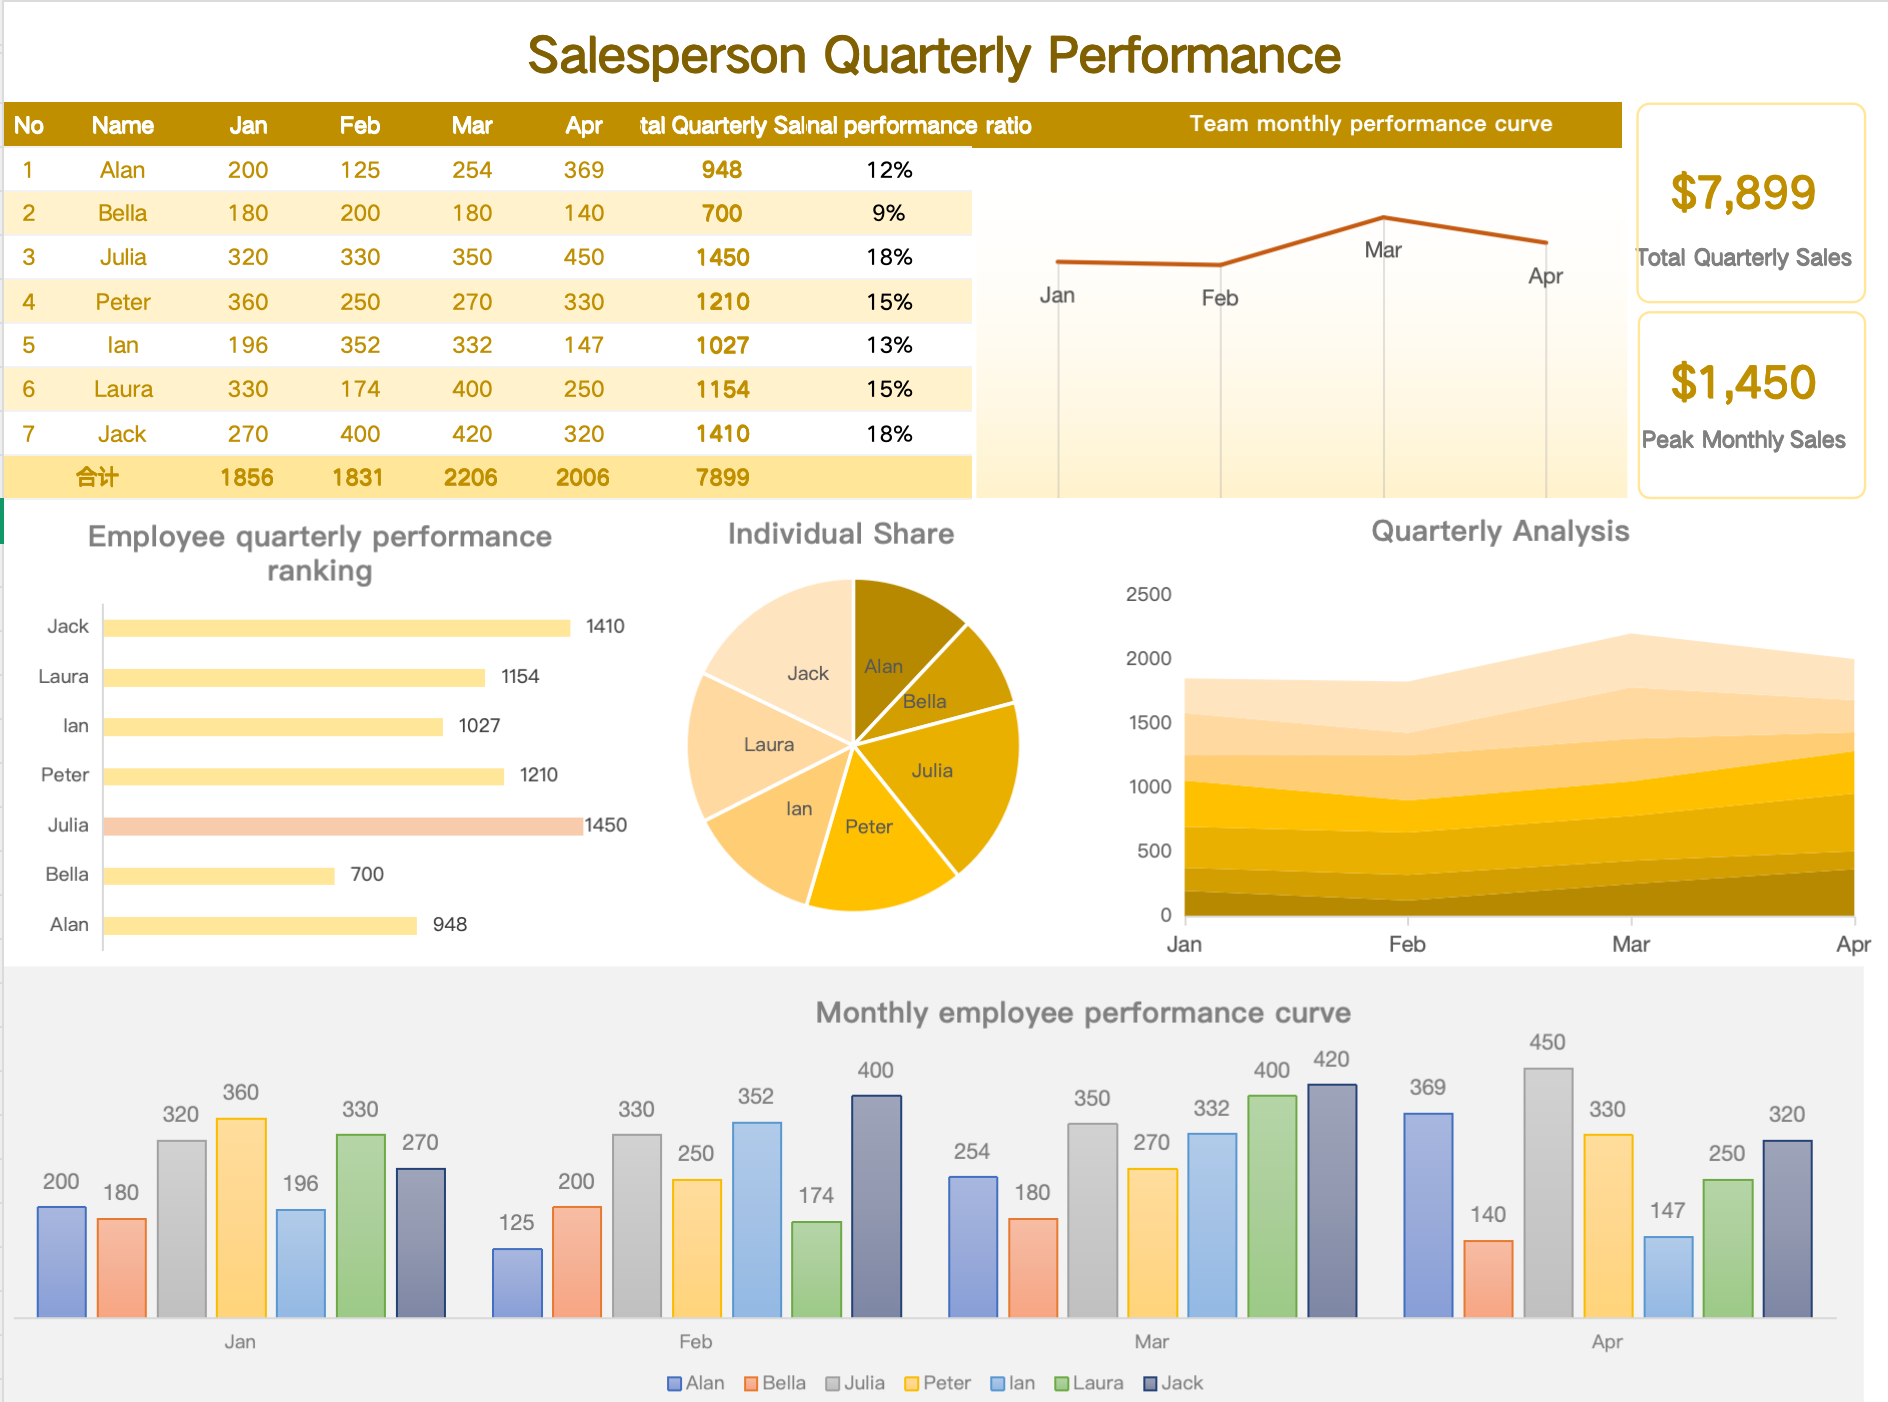
The Salesperson Quarterly Performance Dashboard is a powerful Excel template designed for sales managers, team leaders, and analysts to evaluate and present individual employee performance over a 4-month sales period.
This dashboard combines structured data tables with engaging visuals such as ranking bars, monthly performance curves, pie charts, and quarterly trend lines — giving you everything you need to drive data-based recognition, feedback, and goal setting.
Key Features:
📋 Quarterly Sales Table – Shows monthly sales data per employee and total quarterly performance
📈 Team Monthly Performance Curve – Visualize team progress across time
🏆 Employee Ranking Chart – Compare employee performance side-by-side
🥧 Individual Share Pie Chart – Displays sales contribution ratio
📊 Monthly Employee Performance Bar Chart – Clear visual of monthly efforts
📉 Quarterly Area Trend Chart – Smooth view of accumulated team output
评价
目前还没有评价