Track monthly sales data by product with an interactive Excel dashboard featuring a searchable table, dynamic bar chart, and line graph.
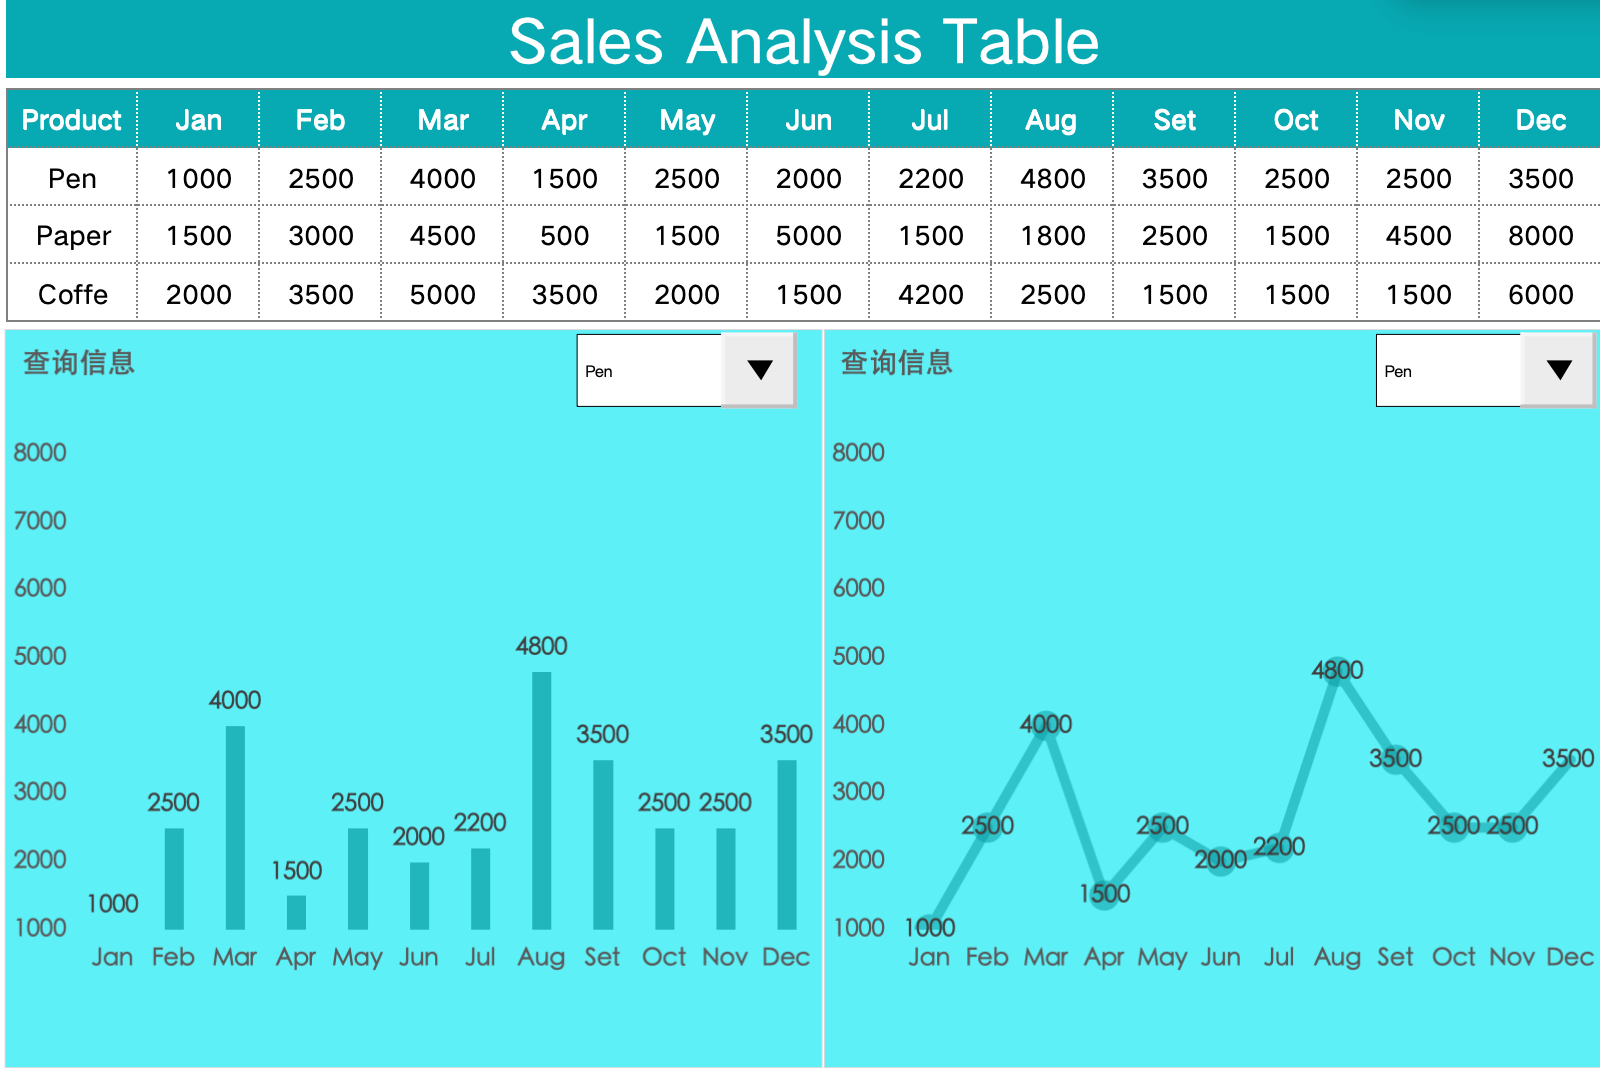
The Sales Analysis Table is a user-friendly Excel tool designed to help businesses, teams, and individuals monitor monthly sales performance by product. With built-in dropdown selectors and automated visualizations, this template makes data exploration simple and insightful.
It combines a clean monthly data table with dynamically updating bar and line charts, enabling users to instantly compare trends across different products like Pens, Paper, and Coffee.
Key Features:
-
📋 Monthly Sales Data Table – View product performance from Jan to Dec
-
🔄 Dropdown Selection Tool – Instantly switch between products
-
📊 Bar Chart Visualization – Visualize monthly sales volume clearly
-
📈 Line Chart Analysis – Track trends and spot growth/decline over time
-
🧩 Fully editable Excel file with no external plugins required
-
💡 Clear, professional layout and turquoise theme
评价
目前还没有评价