An interactive Excel dashboard to track headcount, turnover rates, and recruitment performance across departments with powerful visual analytics.
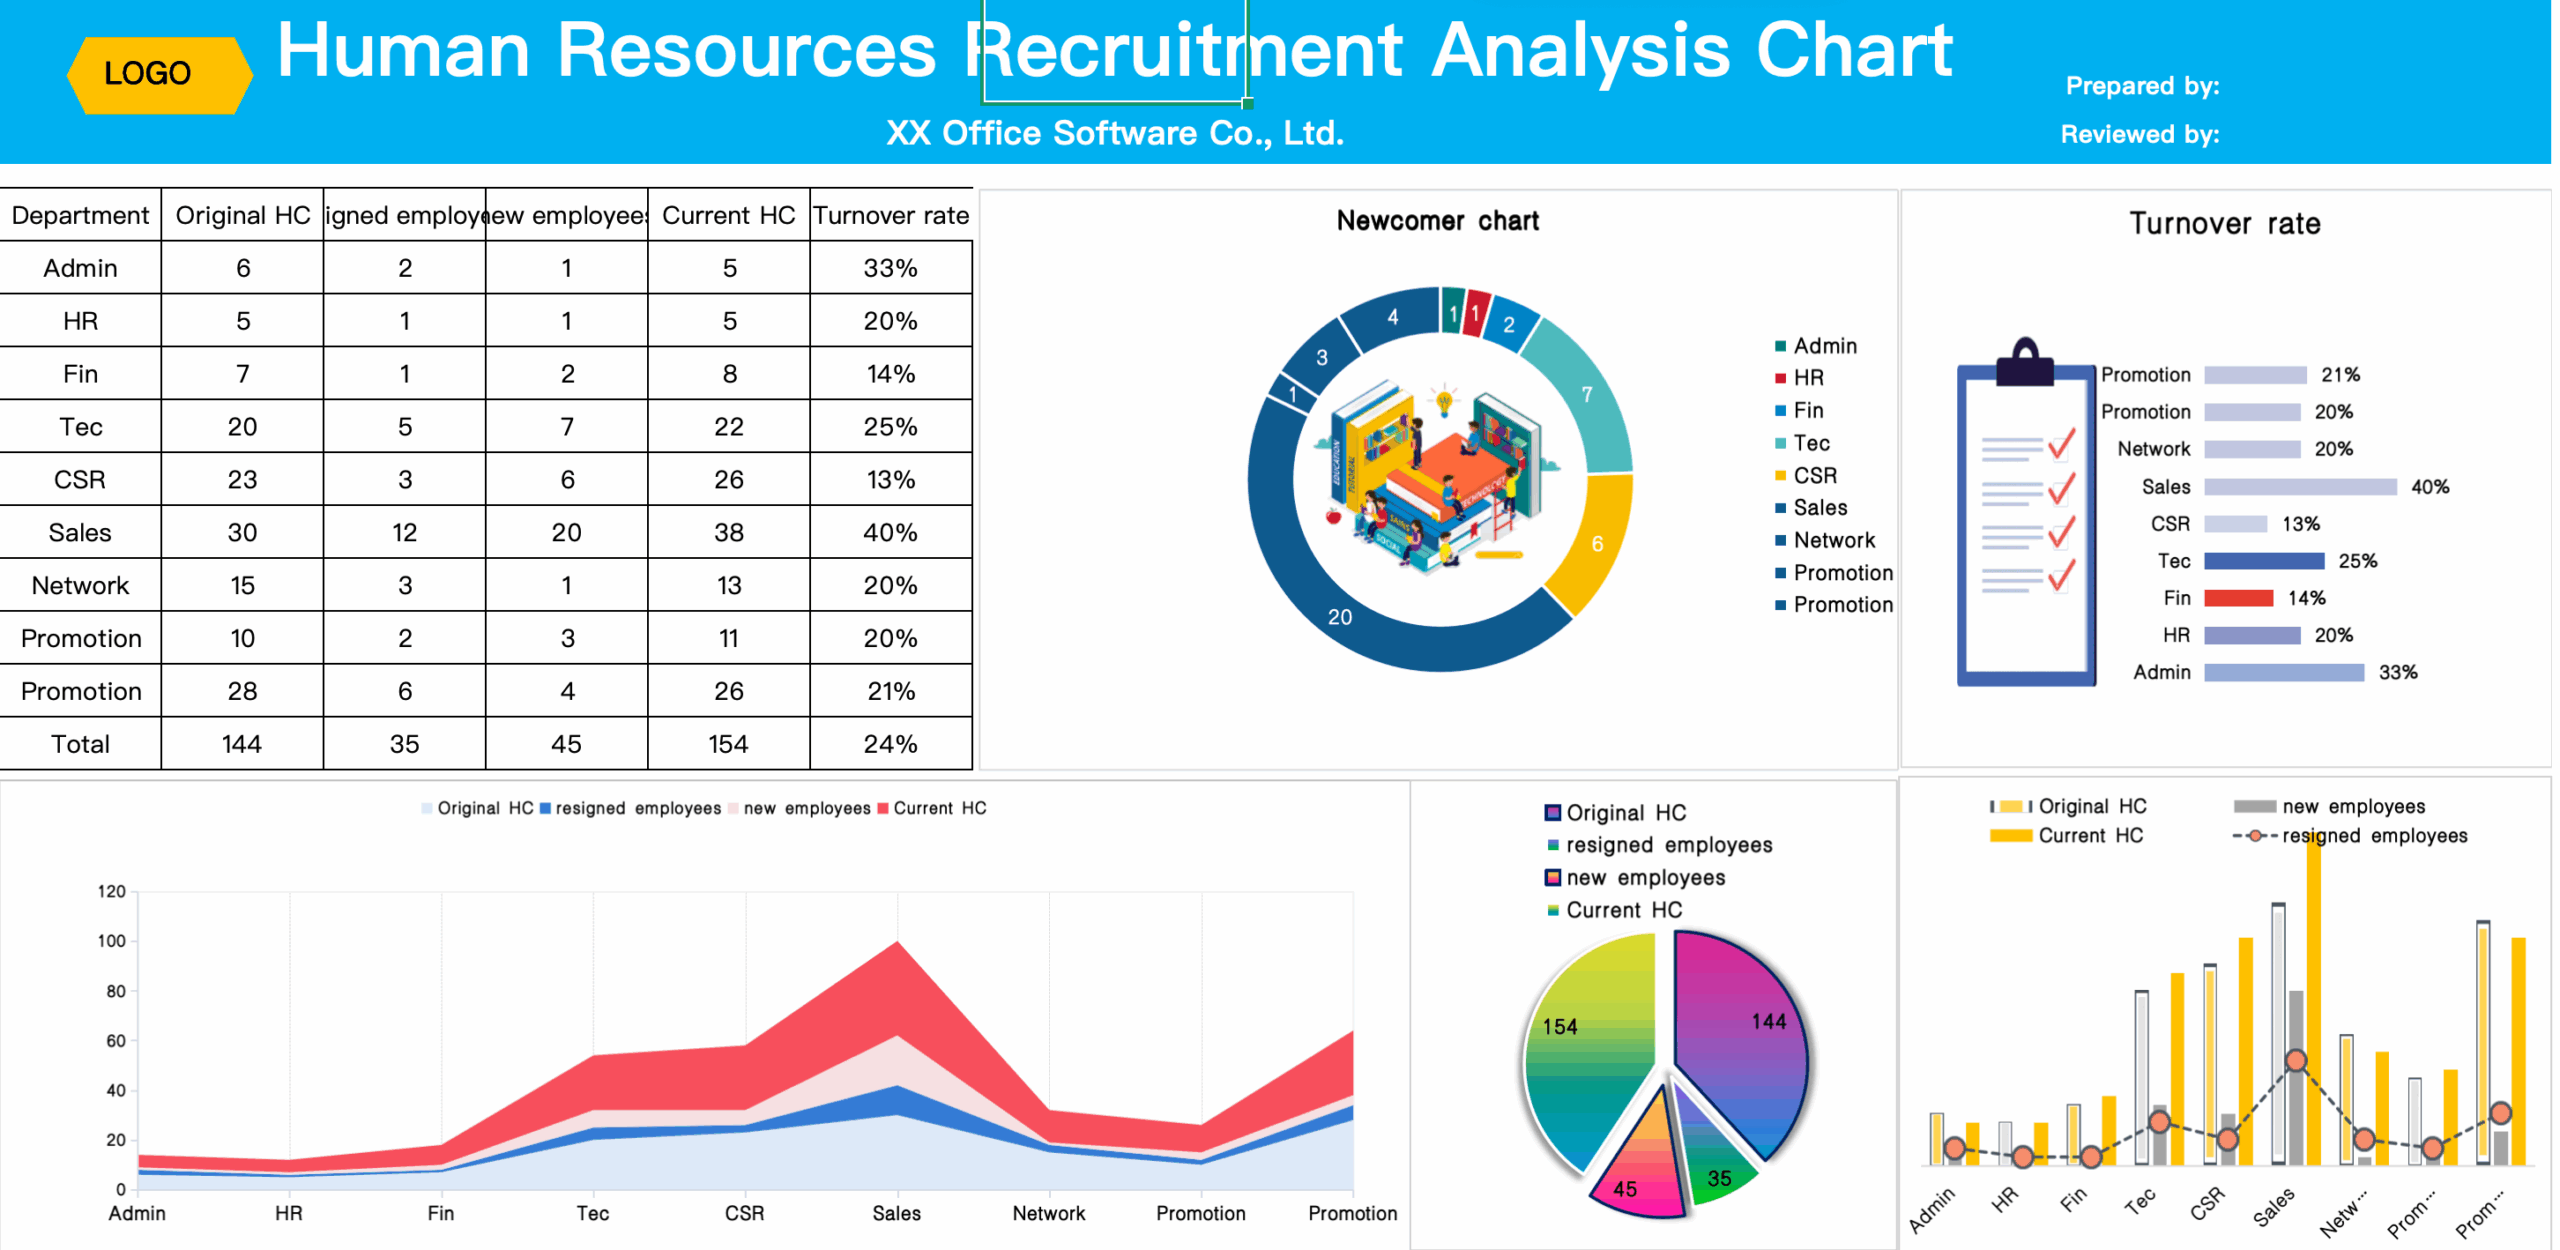
The Human Resources Recruitment Analysis Chart is a fully customizable Excel template designed for HR professionals and managers to monitor workforce changes and recruitment efficiency.
It integrates multiple visual elements to deliver a complete HR snapshot:
-
Department-wise Headcount Table – Compare original, resigned, and current headcount alongside turnover rates.
-
Newcomer Chart – Visualize new hires by department for quick insight.
-
Turnover Rate Analysis – Identify departments with high attrition and address potential retention issues.
-
Trend & Composition Charts – Track headcount changes over time and see the composition of your workforce at a glance.
With its clear layout and colorful visuals, this tool transforms raw HR data into actionable insights, making it ideal for reporting to leadership and improving hiring strategies.
Key Features:
-
📊 Department-level recruitment and turnover tracking
-
📈 Multiple chart types: bar, pie, and trend graphs
-
🎯 Easy-to-read design for quick decision-making
-
🖋 100% editable Excel format
-
💼 Perfect for HR teams, recruiters, and managers

评价
目前还没有评价