A dynamic Excel dashboard for tracking and visualizing workforce changes, including resignations, new hires, and headcount shifts across departments.
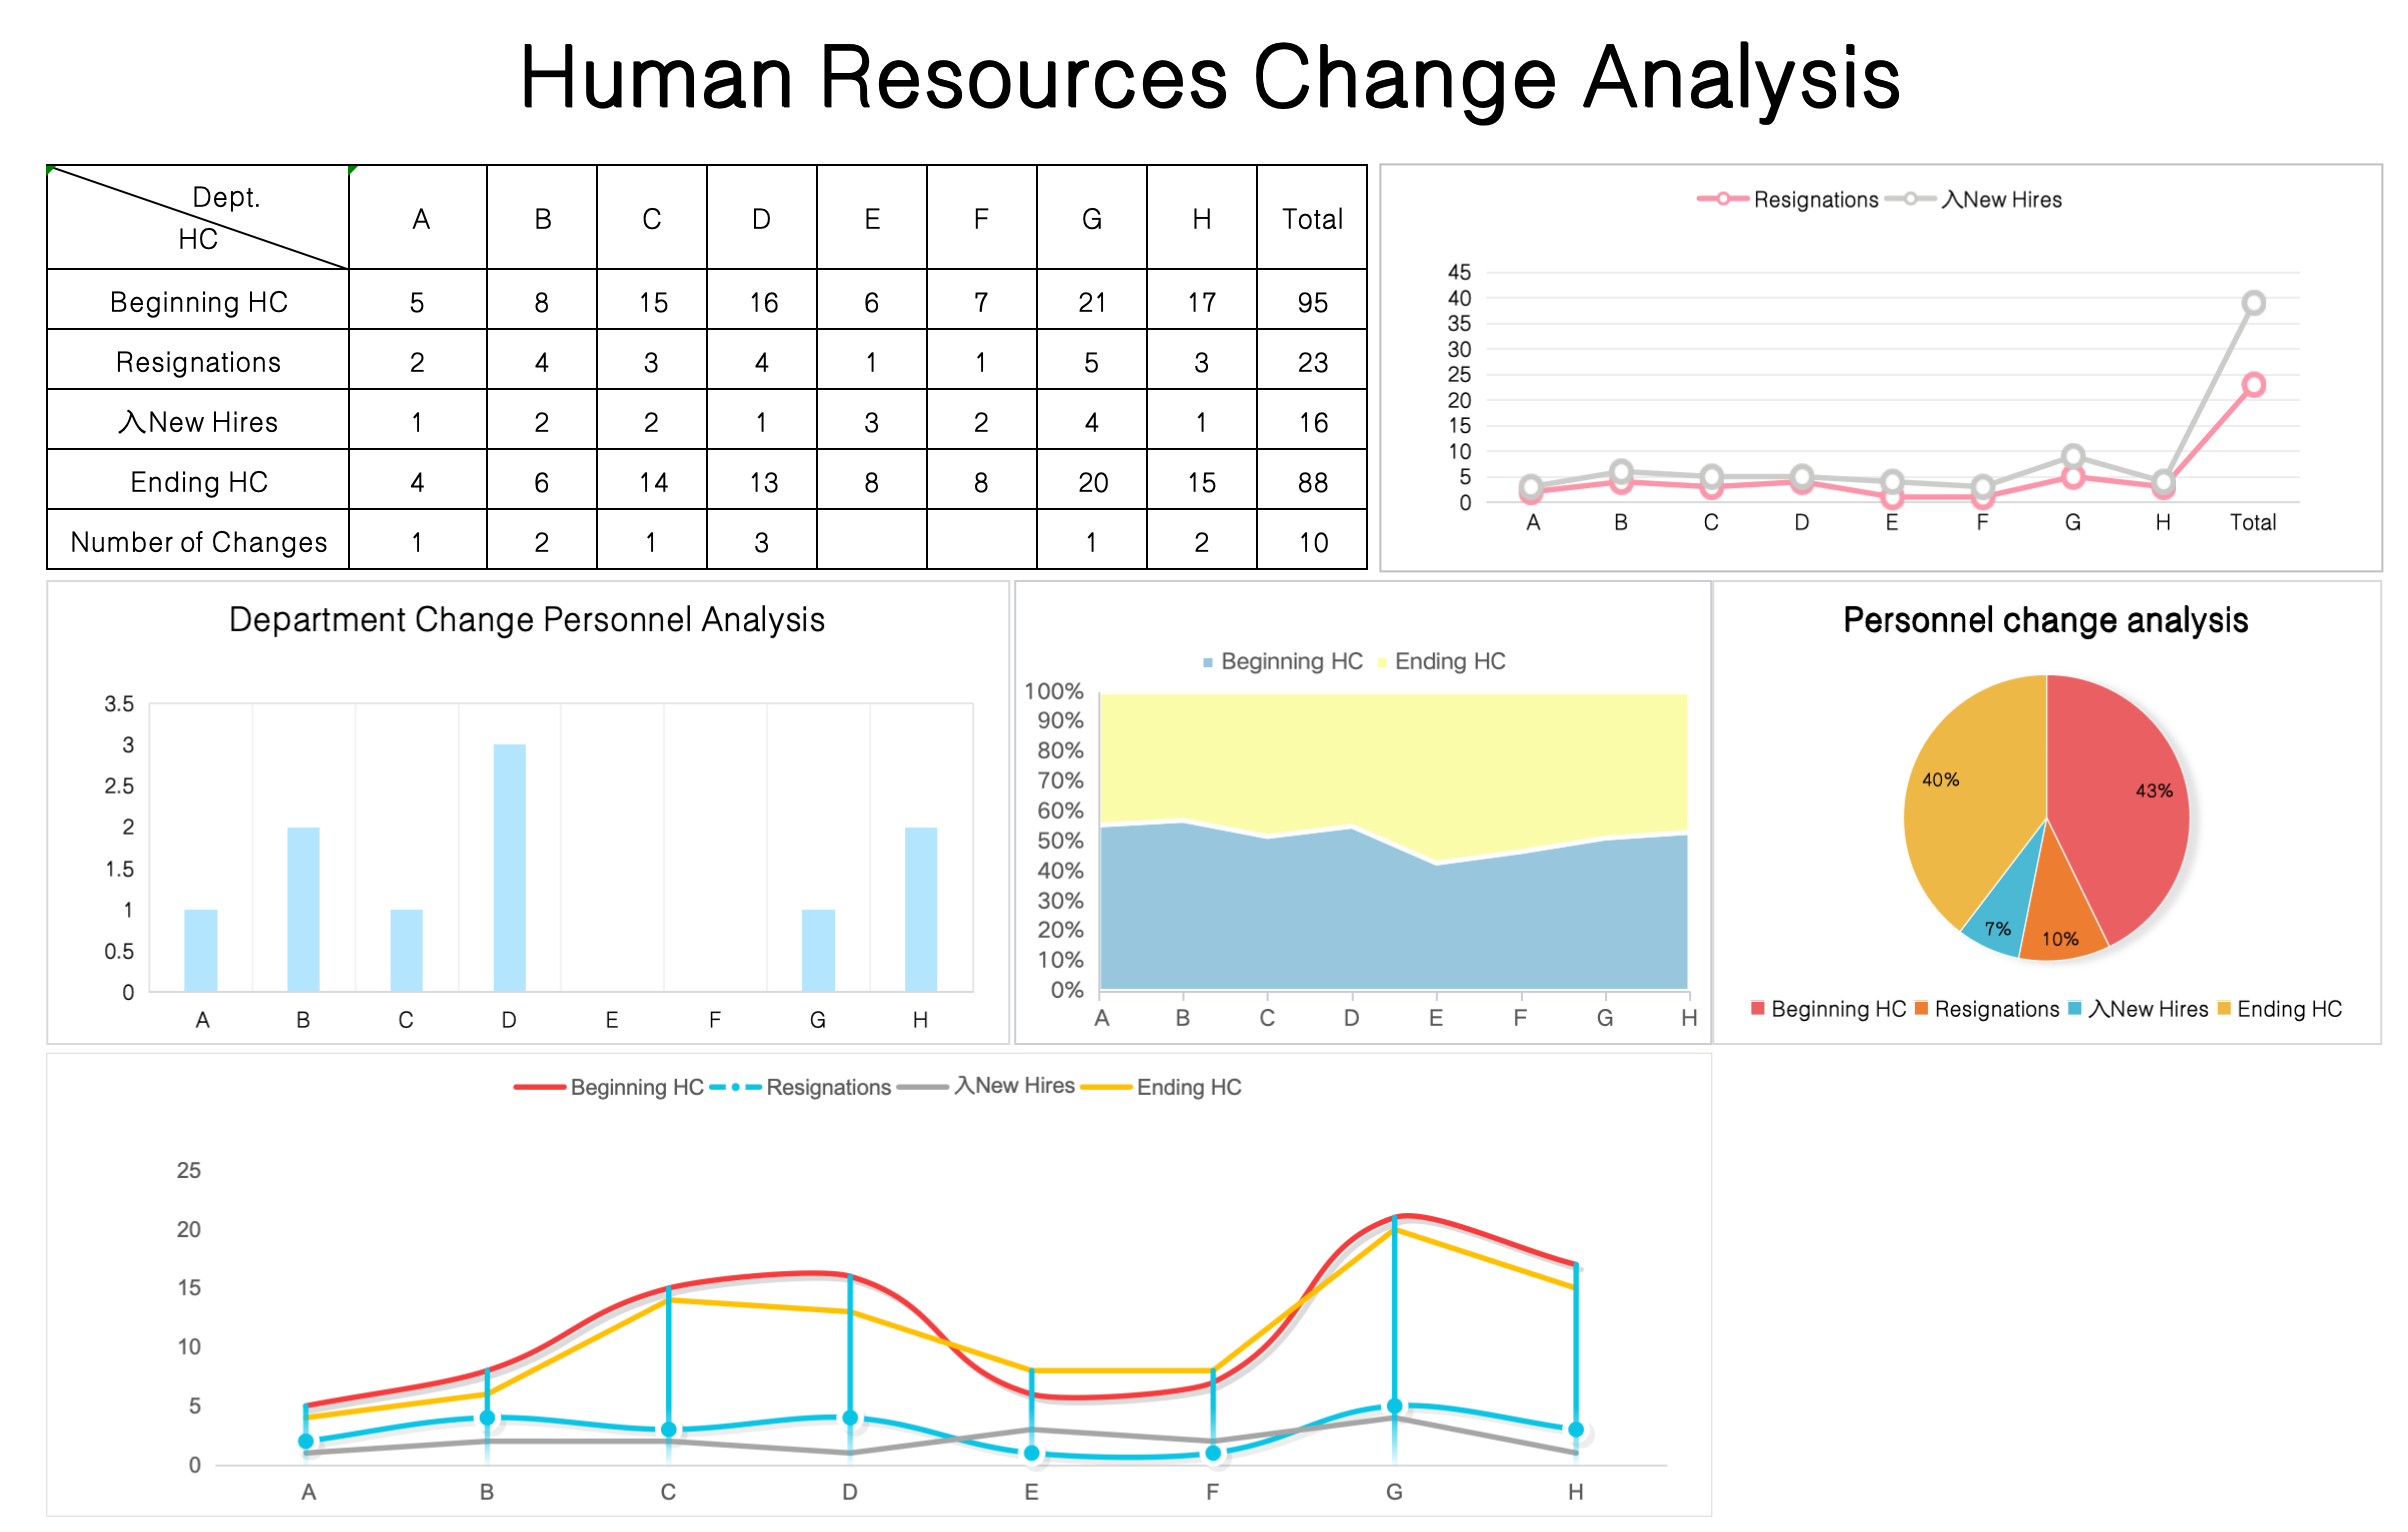
The Human Resources Change Analysis dashboard provides a clear, visual overview of employee movements within an organization. By comparing beginning headcount, resignations, and new hires, HR teams can quickly assess the impact of staffing changes on each department.
Key insights include:
-
Headcount Tracking – Monitor starting and ending headcounts for each department (A–H) with precise figures.
-
Resignation vs. New Hire Trends – Line graphs compare employee departures and incoming staff over time.
-
Departmental Change Overview – Bar charts highlight departments with the most personnel activity.
-
Proportional Analysis – Pie chart displays the percentage distribution of beginning HC, resignations, new hires, and ending HC.
-
Before-and-After Comparison – Stacked area charts show shifts in workforce size at a glance.
With easy-to-read visuals and accurate data breakdowns, this template helps HR managers identify retention issues, evaluate recruitment effectiveness, and make informed staffing decisions.
Key Features:
-
📊 Department-level headcount analysis
-
📈 Resignation and new hire trend tracking
-
🎯 Visual comparison of starting vs. ending workforce
-
🖋 Fully editable Excel format
-
💼 Ideal for HR reporting, workforce monitoring, and turnover analysis

评价
目前还没有评价