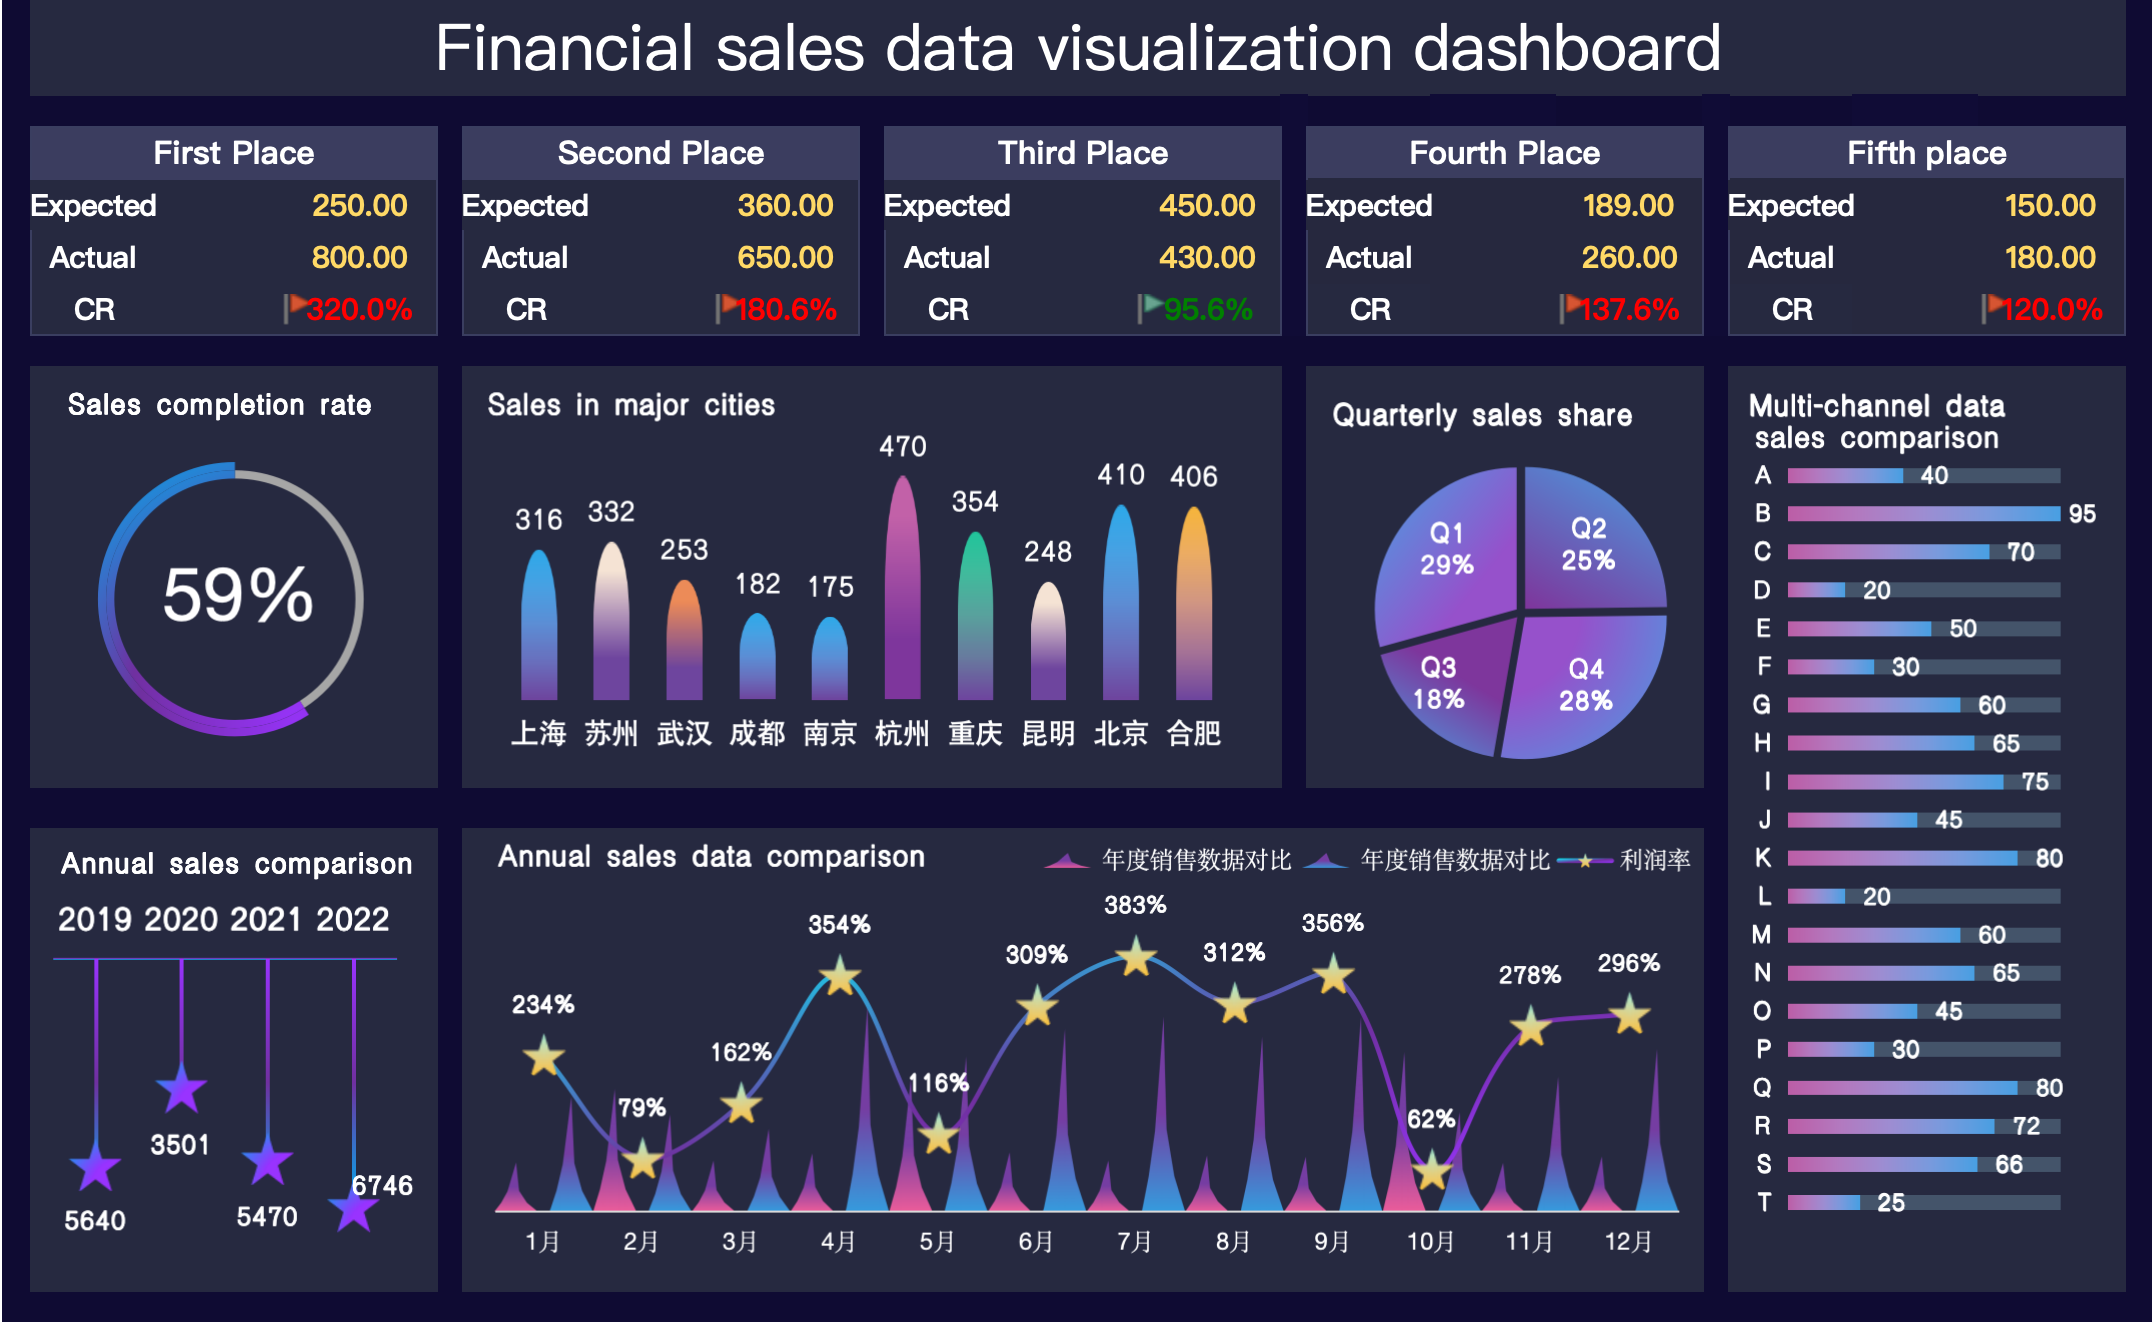
This Excel template provides a comprehensive financial sales data visualization dashboard designed to help businesses analyze and interpret key sales performance metrics. It includes both raw data and interactive dashboard visualizations to support strategic decision-making.
Data Source Section Includes:
-
Sales revenue by major cities
-
Quarterly sales distribution
-
Year-over-year sales comparison
-
Multi-channel sales performance comparison
-
Annual sales comparison
-
Sales target achievement rate
Dashboard Section Includes:
-
Horizontal comparison of top 5 sales figures
-
Circular chart of sales completion rates
-
Bar chart comparing sales by city
-
Pie chart showing quarterly sales distribution
-
Combined line and bar chart for monthly sales over 12 months
Ideal for financial analysts, sales teams, and business managers looking to gain clear insights into sales data trends and performance.
评价
目前还没有评价