The Complete Business Operations Dashboard Suite is an all-in-one Excel template bundle designed to provide businesses, marketers, and analysts with ready-to-use, visually appealing dashboards. This suite covers multiple business operation scenarios, enabling users to track KPIs, visualize trends, and make data-driven decisions without complex setup.
Key Features
-
📊 Multi-Purpose Dashboards – Includes sales performance, marketing analysis, customer behavior tracking, website analytics, and more.
-
📈 Interactive Data Visualization – Professionally designed charts, graphs, and KPI widgets for instant insights.
-
⚡ Ready-to-Use Templates – Simply replace the sample data with your own and get real-time updates.
-
📂 100% Editable in Excel – No special software required; compatible with Microsoft Excel and Google Sheets.
-
🎨 Professional Design – Clean, modern layouts optimized for presentations and reports.
-
🔍 Comprehensive Coverage – From e-commerce sales tracking to customer source analysis, all in one package.
Included Dashboards
-
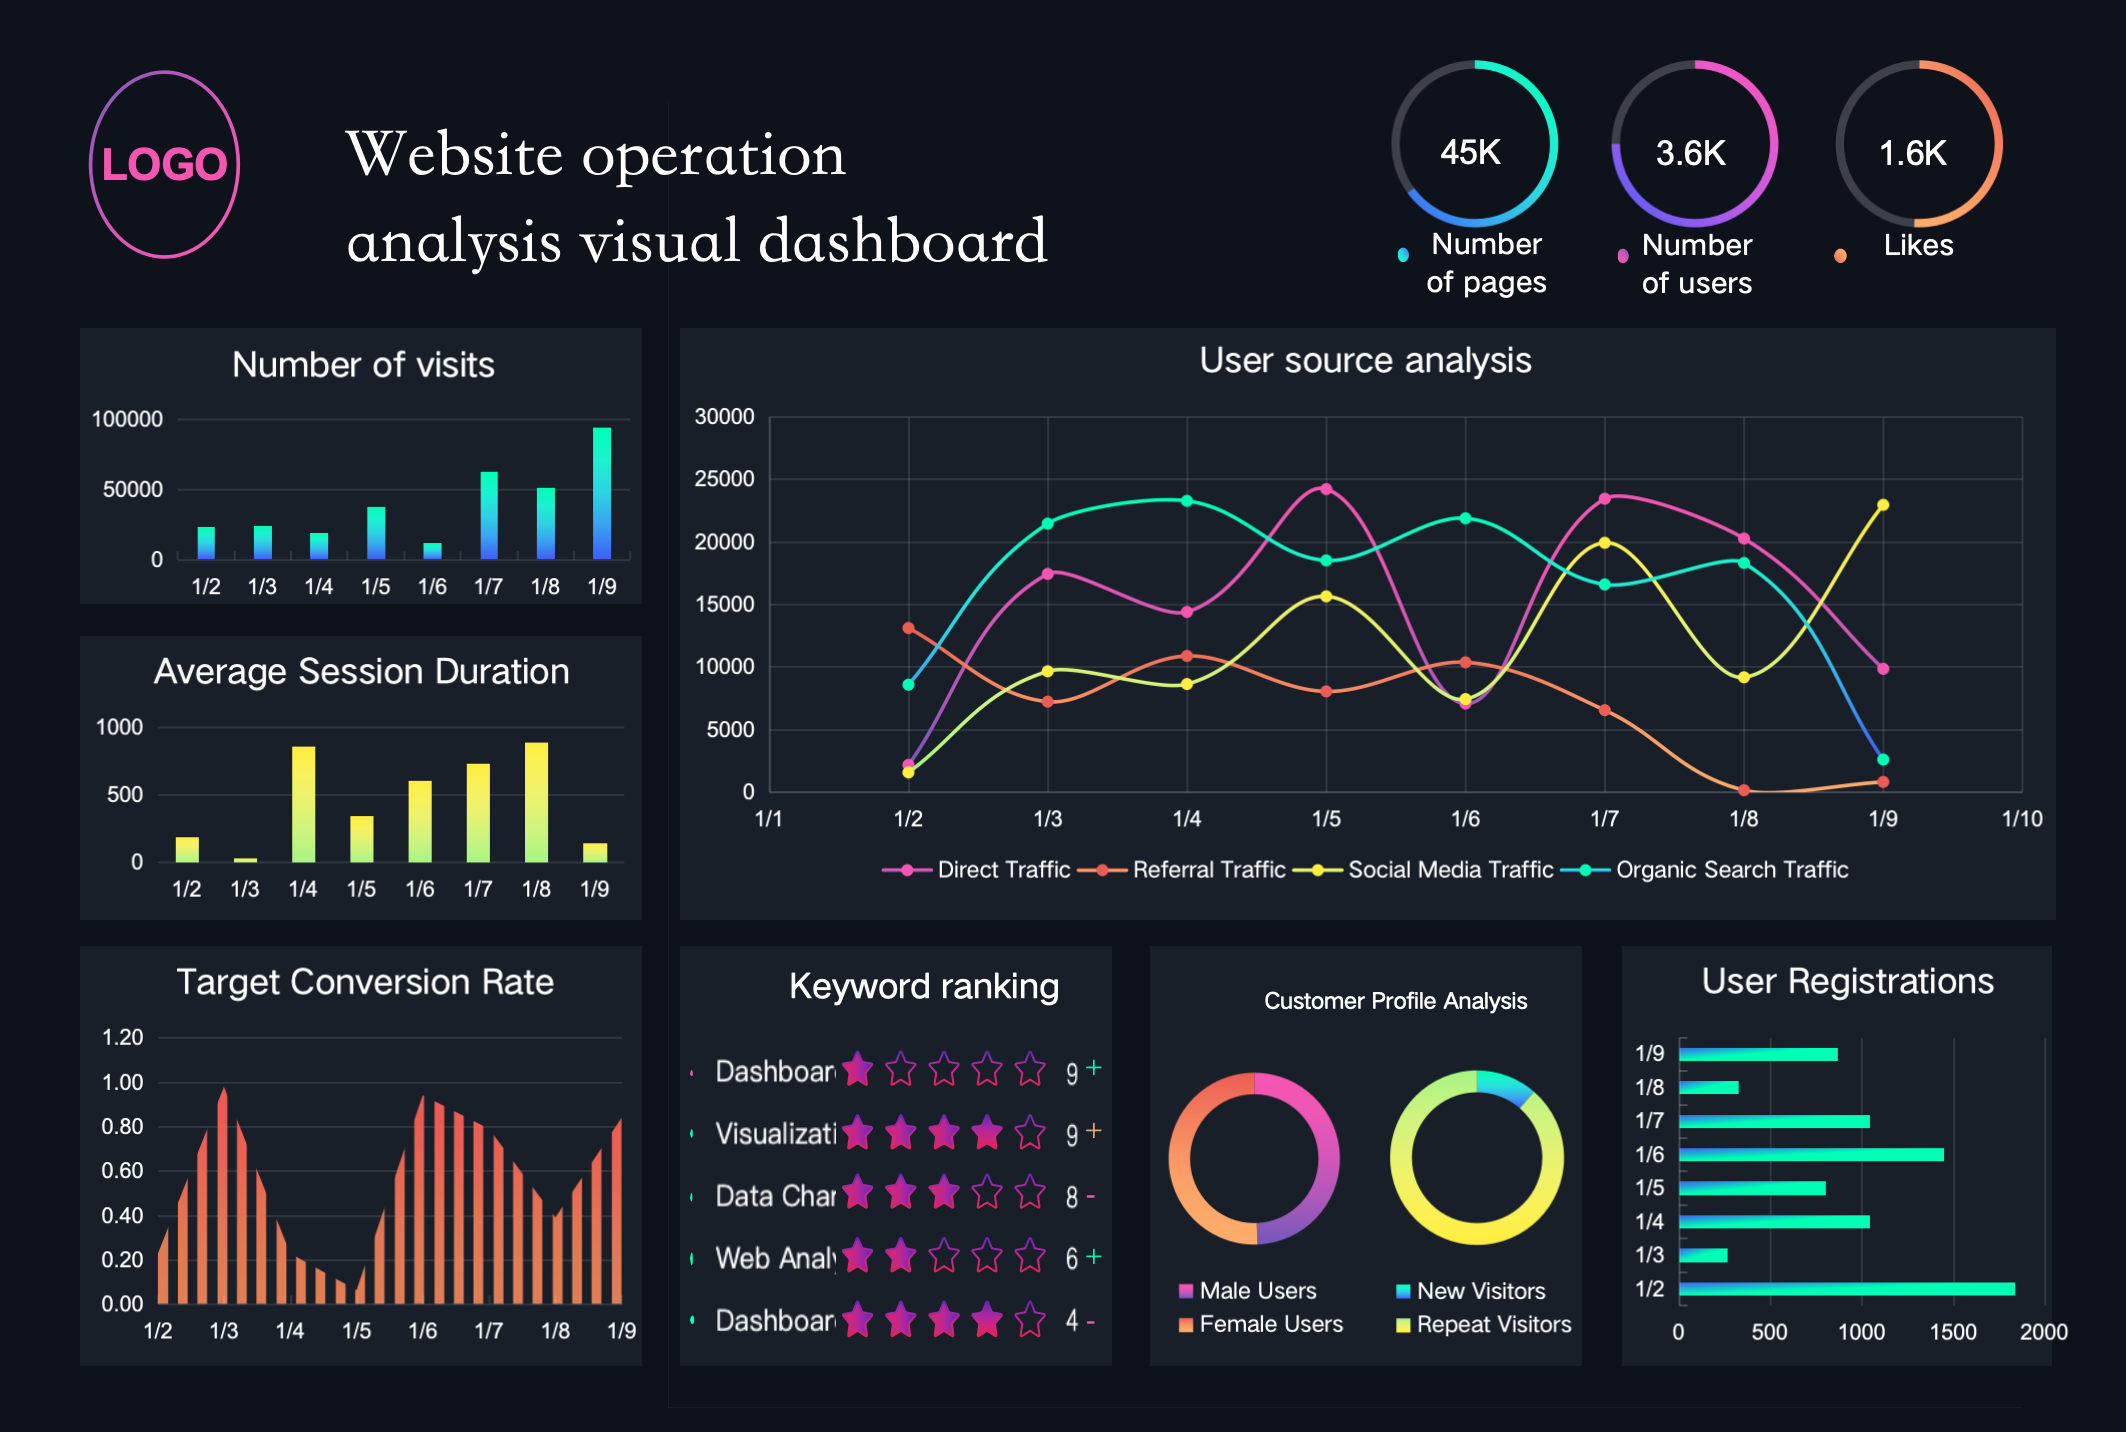
Website Operation Analysis Dashboard – Monitor visits, session duration, and conversion rates.
-
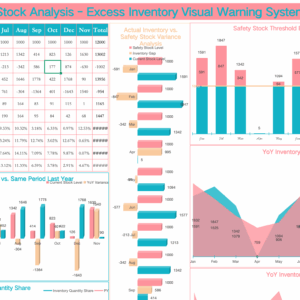
E-Commerce Sales Data Dashboard – Track daily sales, top products, and conversion funnels.
-
Marketing Data Dynamic Dashboard – Visualize monthly and annual sales performance.
-
User Operations Analysis Report – Analyze user behavior, loyalty, and monthly activity.
-
Customer Source Analysis Table – Identify top-performing marketing channels and referrals.
评价
目前还没有评价