Compare monthly sales output, track growth trends, and visualize team performance with this dynamic Excel dashboard.
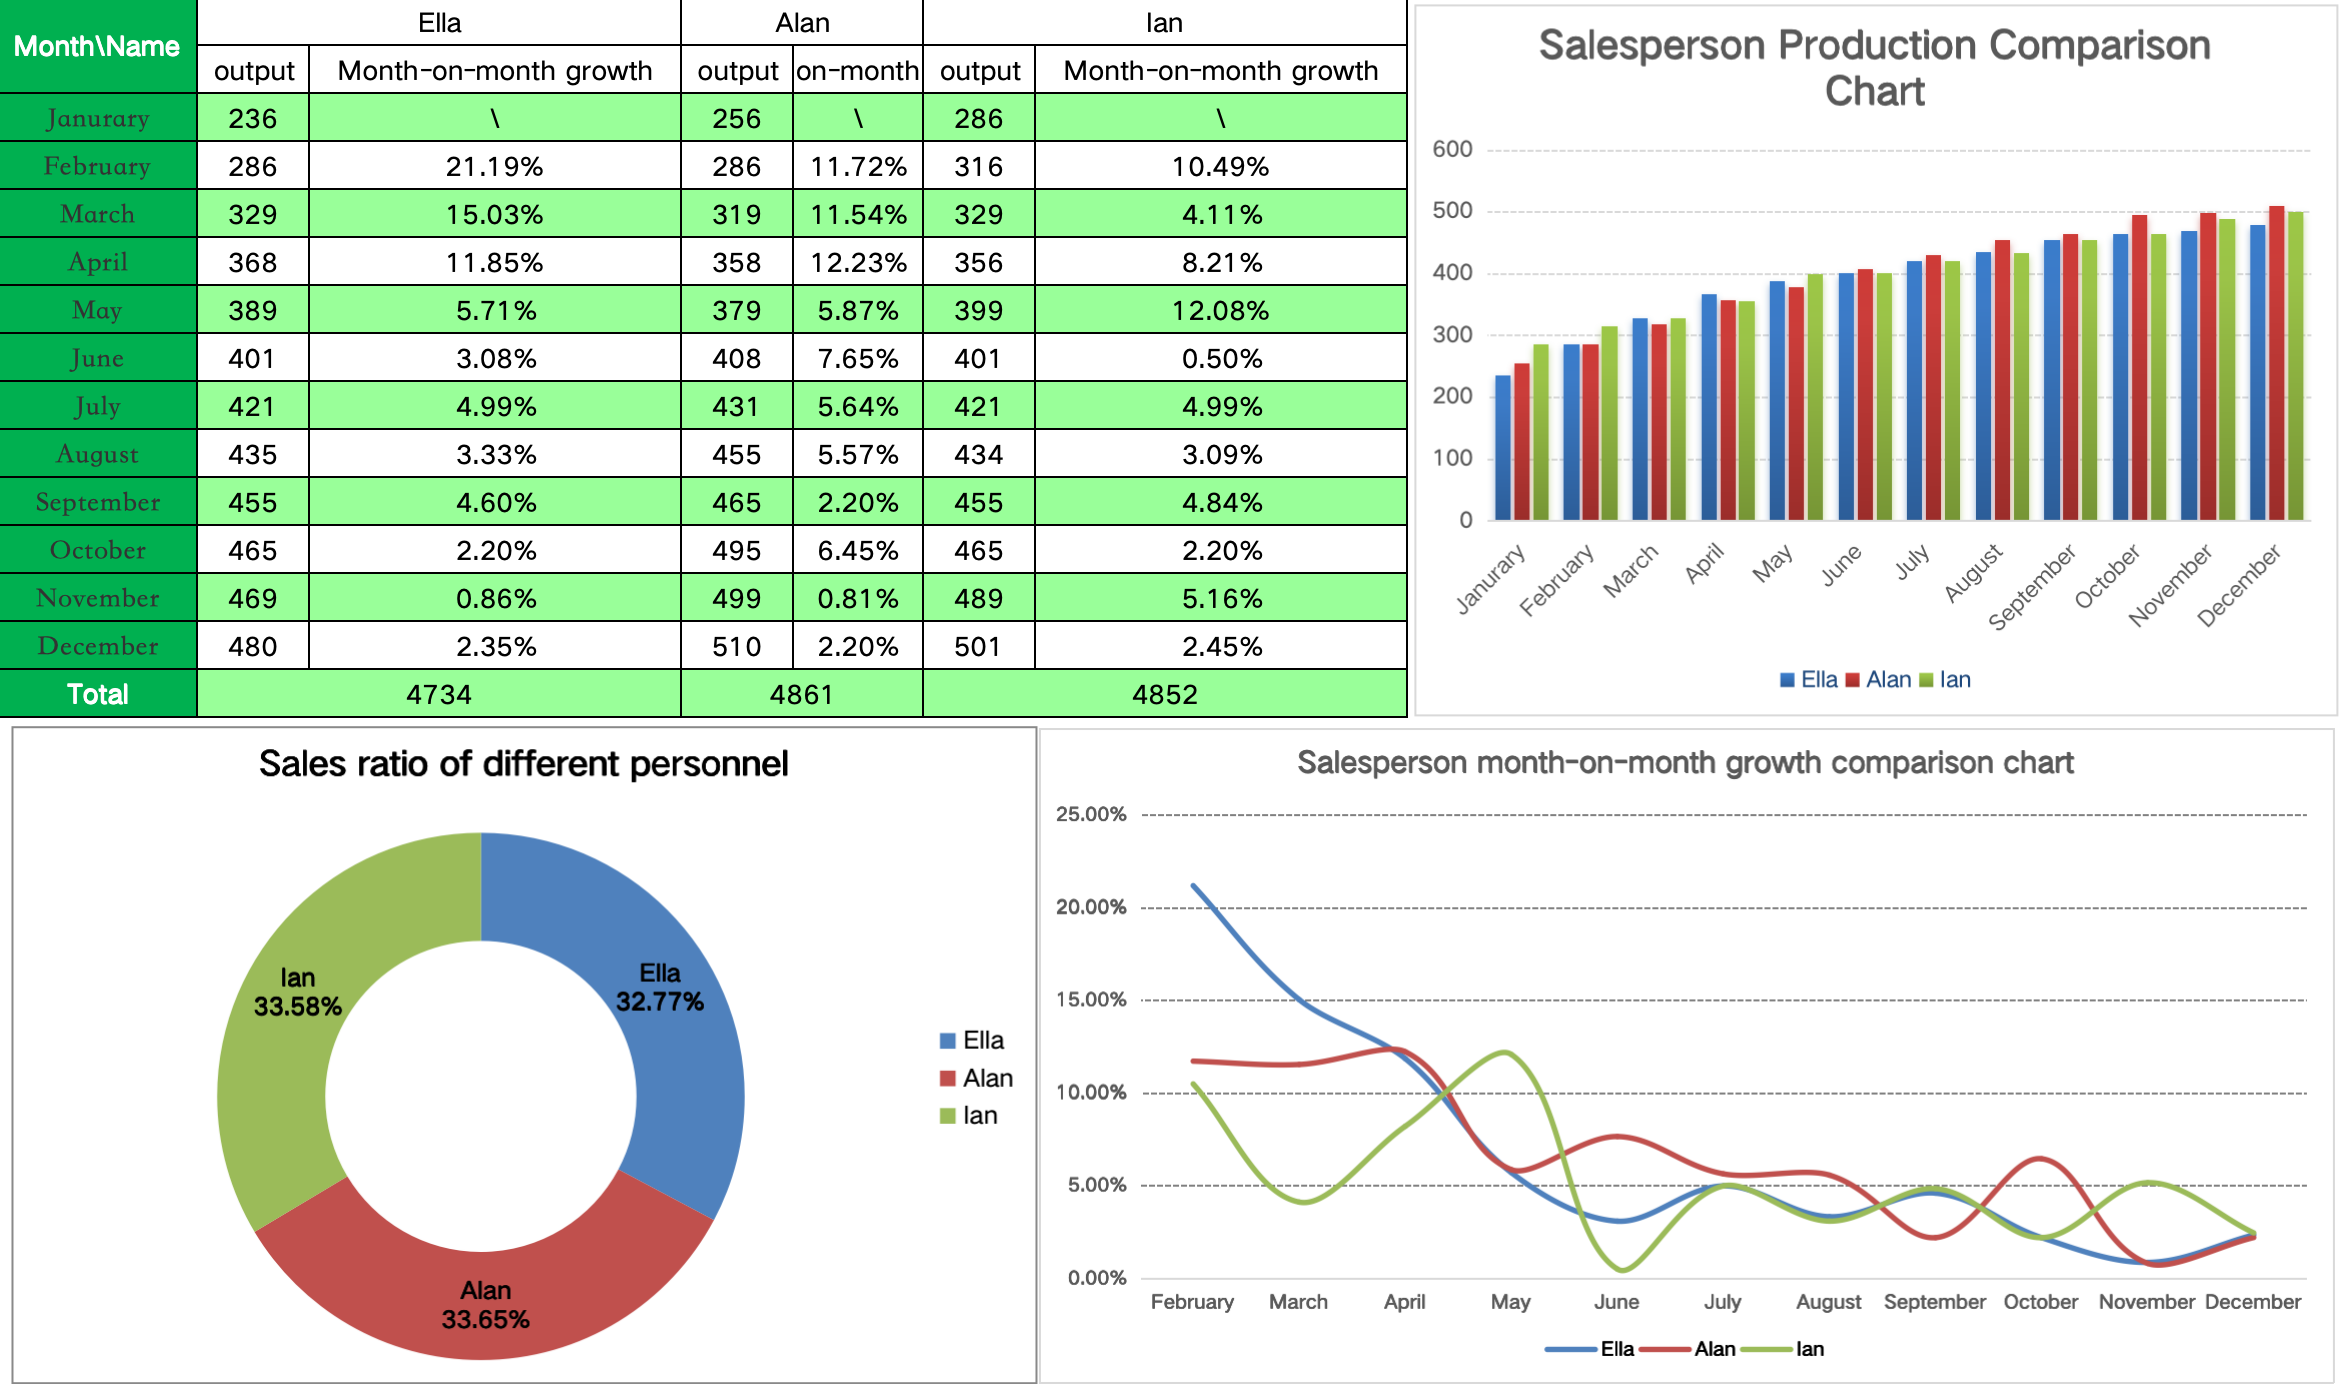
The Monthly Sales Performance Comparison Dashboard is a professional Excel template designed to help sales teams and managers analyze, compare, and present individual salesperson performance over time. With structured data tables and multiple chart types, it offers a comprehensive view of monthly sales output, growth rates, and team contributions.
Ideal for performance reviews, KPI reporting, and data-driven decision-making, this dashboard enhances your ability to track progress, reward high performers, and optimize team output.
评价
目前还没有评价