A professional Excel dashboard collection for analyzing inventory, stock levels, and warehouse performance with clear visualization and actionable insights.
The Inventory & Stock Analytics Dashboard Suite is designed to help businesses monitor, manage, and optimize their inventory operations with ease. This bundled collection includes multiple Excel dashboards that transform raw stock data into dynamic, interactive, and visual reports.
Key capabilities include:
-
📦 Regional Inventory Analysis – Monitor stock distribution across multiple warehouses and regions, including market share and total volume insights.
-
📊 Monthly & Quarterly Stock Tracking – Breakdown by month and region to identify fluctuations and optimize supply planning.
-
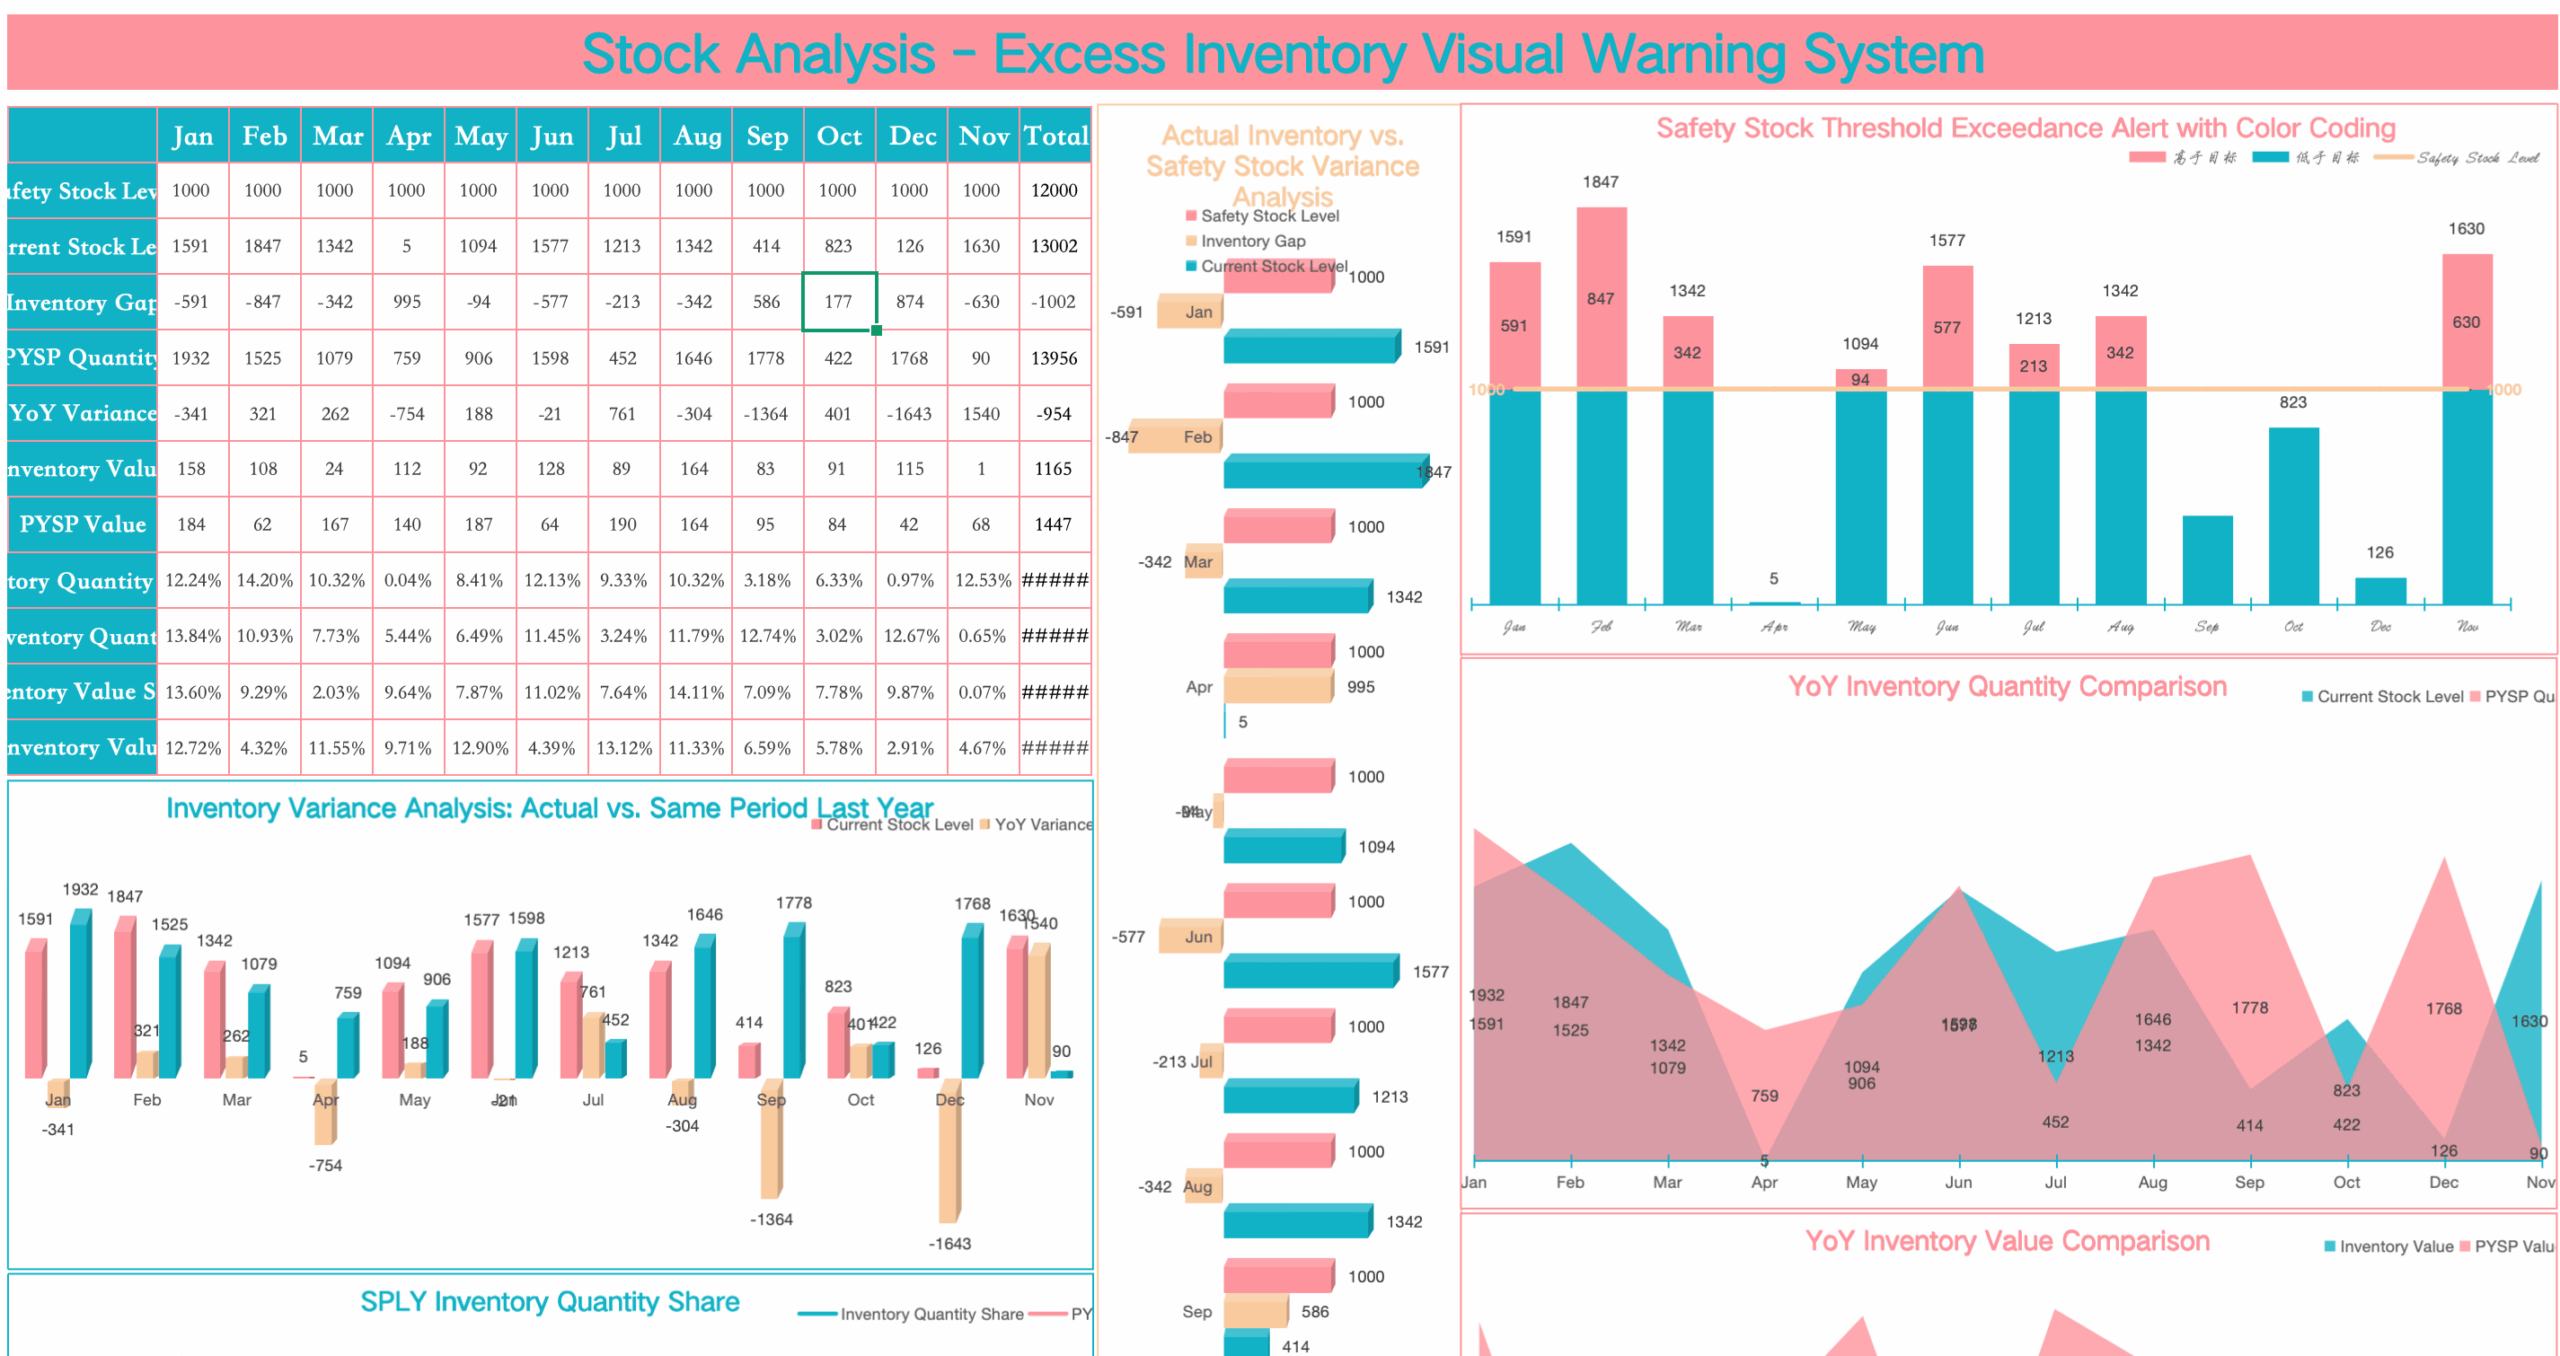
🚨 Excess Inventory & Warning System – Detect safety stock threshold breaches with automated variance alerts and color-coded visuals.
-
📈 Year-End Inventory Visualization – Track inbound vs. outbound flow, inventory balances, and long-term storage trends.
-
📉 Variance & Trend Analysis – Compare actual stock vs. safety stock, YoY inventory changes, and variance against targets.
With its combination of intuitive charts, automated calculations, and professional formatting, this suite helps companies reduce risks of overstocking or understocking while improving supply chain efficiency.
Key Features:
-
✅ Pre-built Excel dashboards with ready-to-use formulas
-
📊 Visualized charts: bar, line, funnel, radar, donut, and variance graphs
-
🔔 Color-coded alerts for stock threshold exceedance
-
🖋 Fully editable & customizable for your data
-
💼 Covers quarterly, monthly, and year-end inventory analysis
评价
目前还没有评价