A dynamic Excel dashboard for tracking, comparing, and analyzing monthly income, costs, taxes, and sales expenses with visual clarity.
The Income and Expenditure Analysis Dashboard is an advanced Excel template designed to help businesses monitor financial performance in real time.
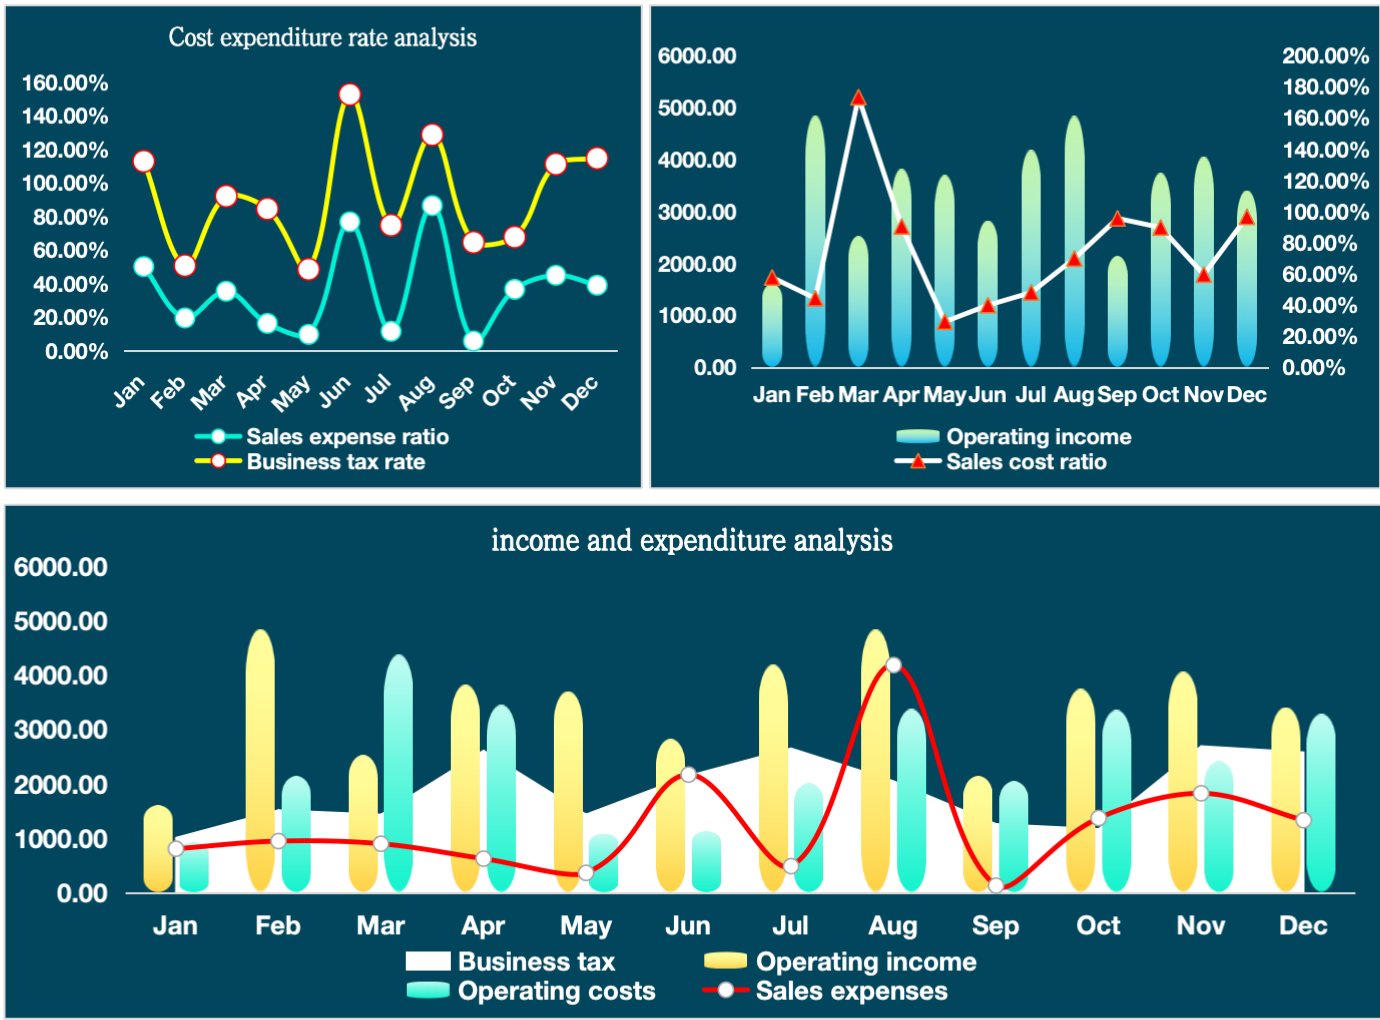
This tool combines three powerful visual reports:
-
Cost Expenditure Rate Analysis – Compare sales expense ratio and business tax rate trends.
-
Operating Income vs. Sales Cost Ratio – Track profitability and efficiency each month.
-
Full Income & Expenditure Breakdown – View business tax, operating income, costs, and sales expenses in one integrated chart.
With its vibrant, presentation-ready visuals and fully editable data tables, this template simplifies complex financial data, making it ideal for monthly reporting, budgeting, and business performance reviews.
Key Features:
-
📊 Track income, costs, taxes, and expenses monthly
-
📈 Analyze ratios for deeper financial insight
-
🎨 Clear, modern charts for professional reporting
-
🖋 Fully customizable Excel file
-
💼 Suitable for SMEs, finance teams, and business owners
评价
目前还没有评价