Track income and expenditure across multiple accounts with a clean, visual Excel dashboard.
The Financial Statements Dashboard is a professional Excel template designed for businesses, freelancers, and finance managers to monitor daily income and expenses with clarity.
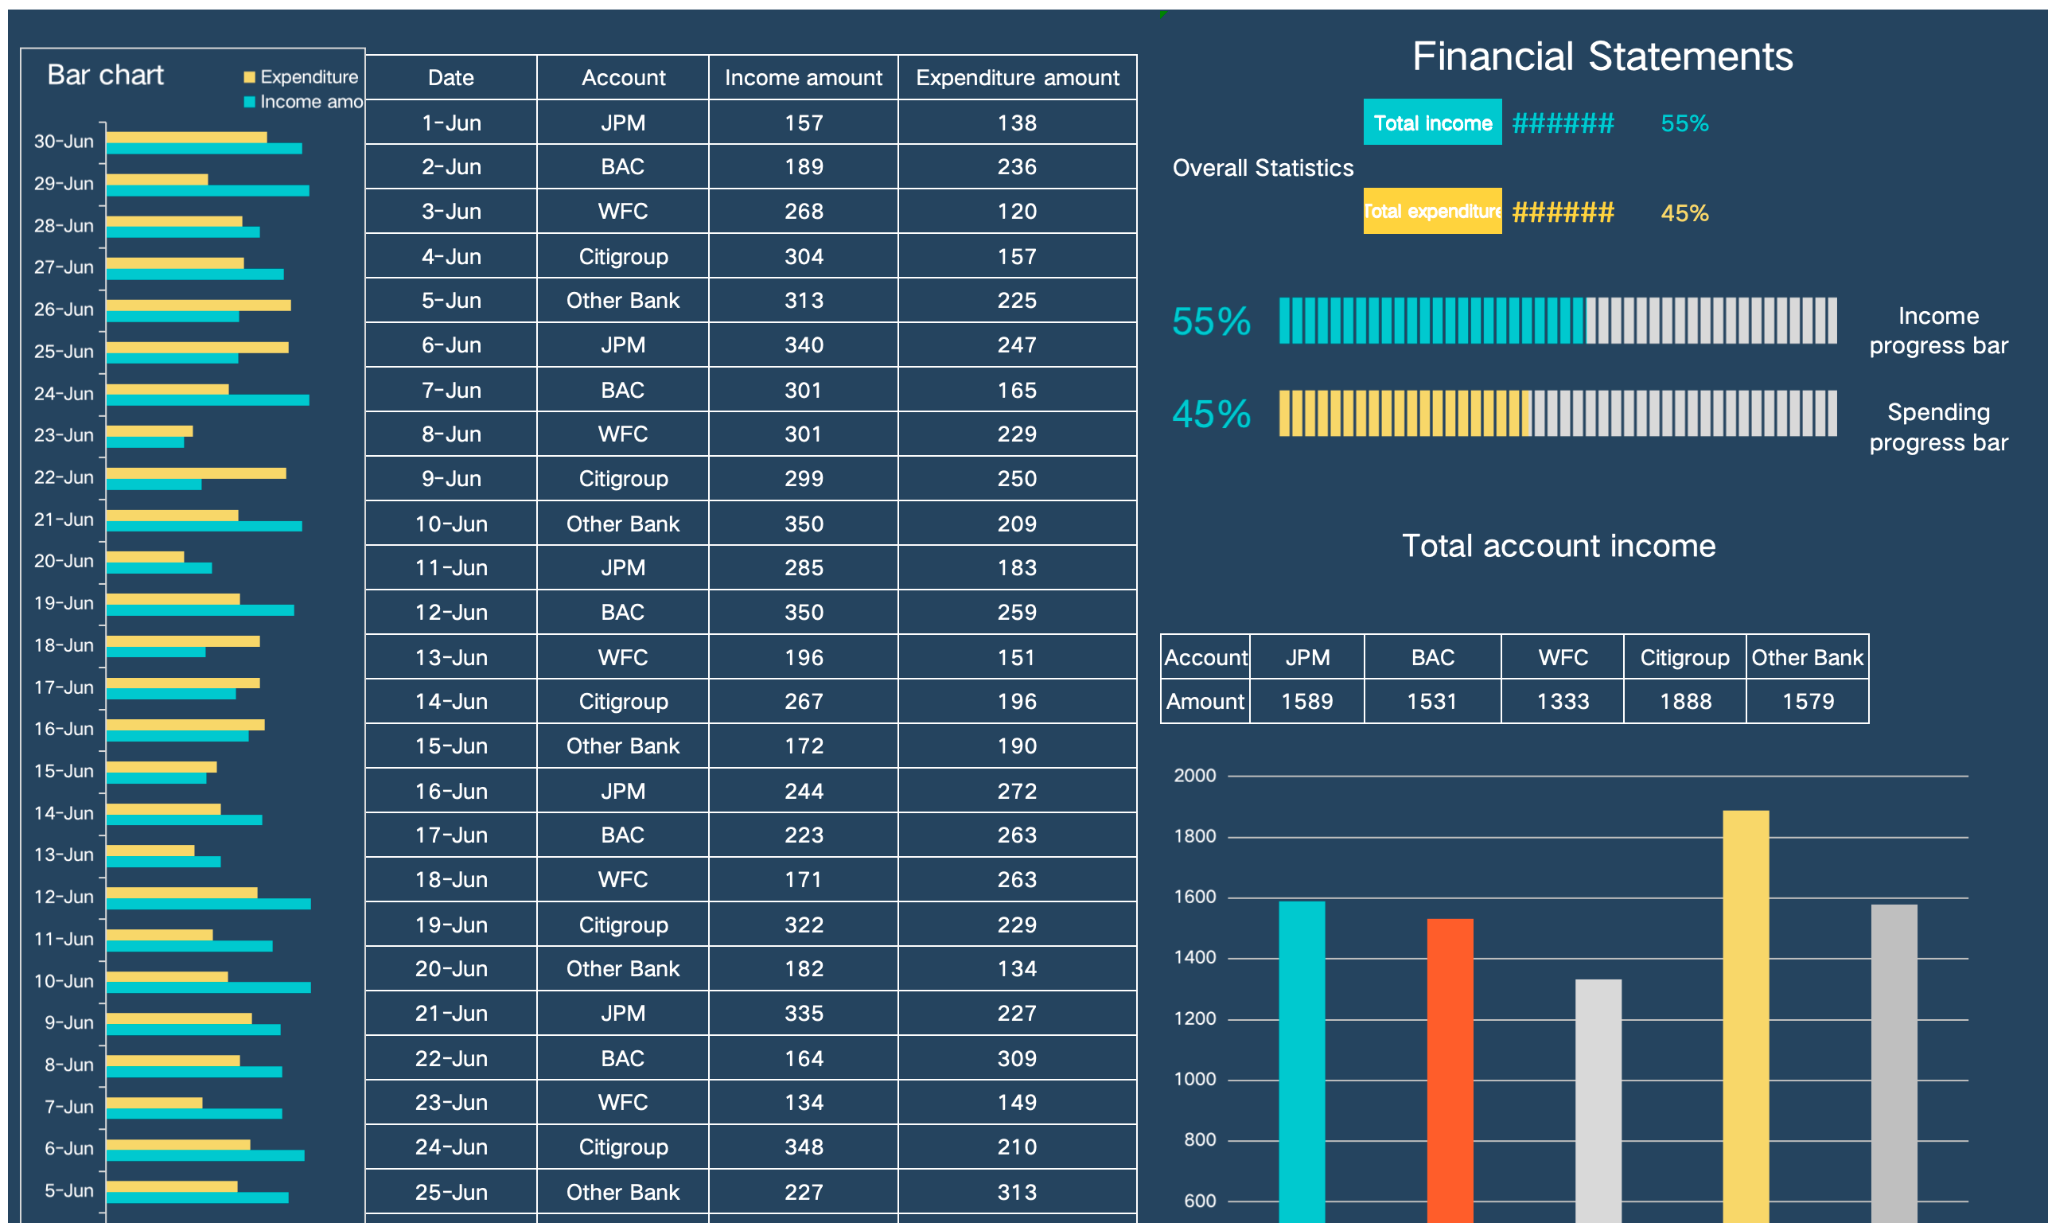
This template organizes your financial data into an interactive dashboard, showing daily transaction details, total account income, and spending ratios. It includes bar charts, progress bars, and summary tables for quick insight into your financial performance.
Key Features:
-
📅 Daily Transaction Table – Record and view income & expenditure for each account
-
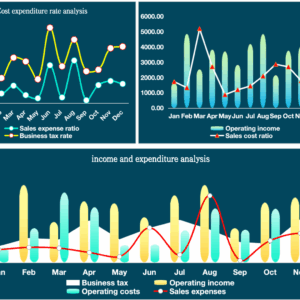
📊 Dual-Bar Chart – Compare daily income and expenses visually
-
📈 Progress Bars – Show income vs. expenditure ratio (percent-based)
-
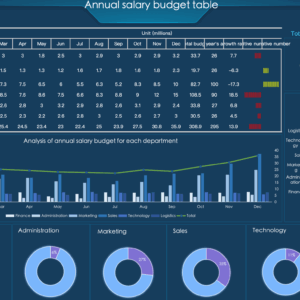
🏦 Total Account Income Table – Summarizes each account’s total income
-
📉 Income Ranking Chart – Compare accounts by total income
-
🎨 Clean dark-theme design for professional reports
-
🖋 Fully editable Excel file — just replace sample data with your own
评价
目前还没有评价