A professional Excel dashboard for analyzing regional sales, product performance, personnel output, and year-on-year growth — all in one interactive visual tool.
Product Description:
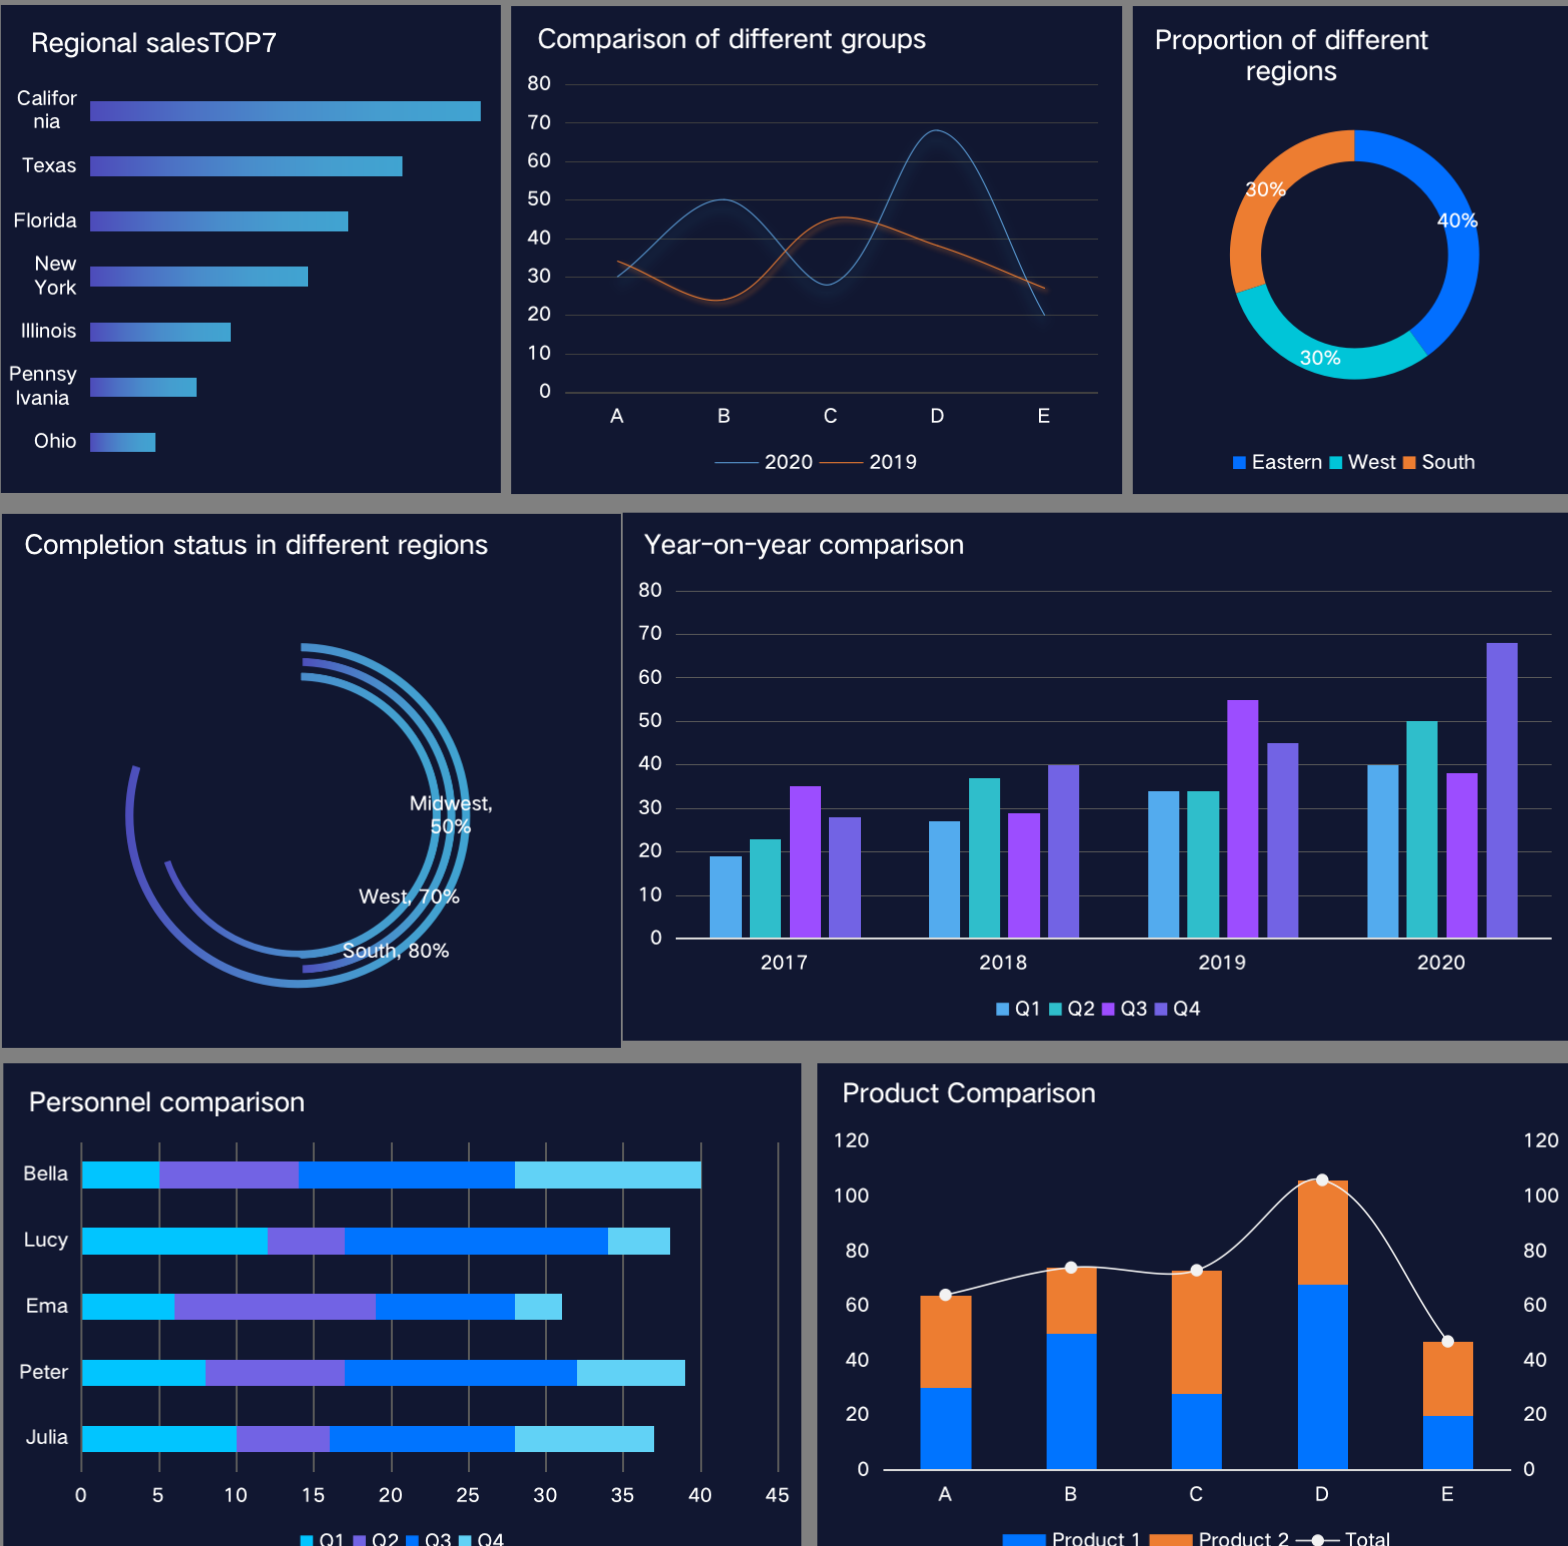
The Sales Analysis Dashboard is a feature-rich Excel template designed for businesses that want to monitor sales performance across regions, compare product categories, evaluate personnel contributions, and track multi-year growth.
With clean dark-themed visuals and multiple chart types, this dashboard turns raw data into actionable insights, making it perfect for management reviews, marketing reports, and strategic planning.
Key Features:
-
📍 Regional Sales TOP 7 – Identify your highest-performing markets
-
📊 Group Comparison Chart – Track performance trends across groups or categories over time
-
🥧 Proportion of Regions Chart – Visualize market share by region (Eastern, West, South)
-
📈 Completion Status by Region – Monitor progress toward sales targets
-
📆 Year-on-Year Comparison – Analyze quarterly sales growth over multiple years
-
👥 Personnel Comparison – Compare output across team members
-
📦 Product Comparison Chart – Evaluate product performance side-by-side
评价
目前还没有评价