Track, compare, and visualize sales data across regions, products, and channels with this powerful Excel dashboard.
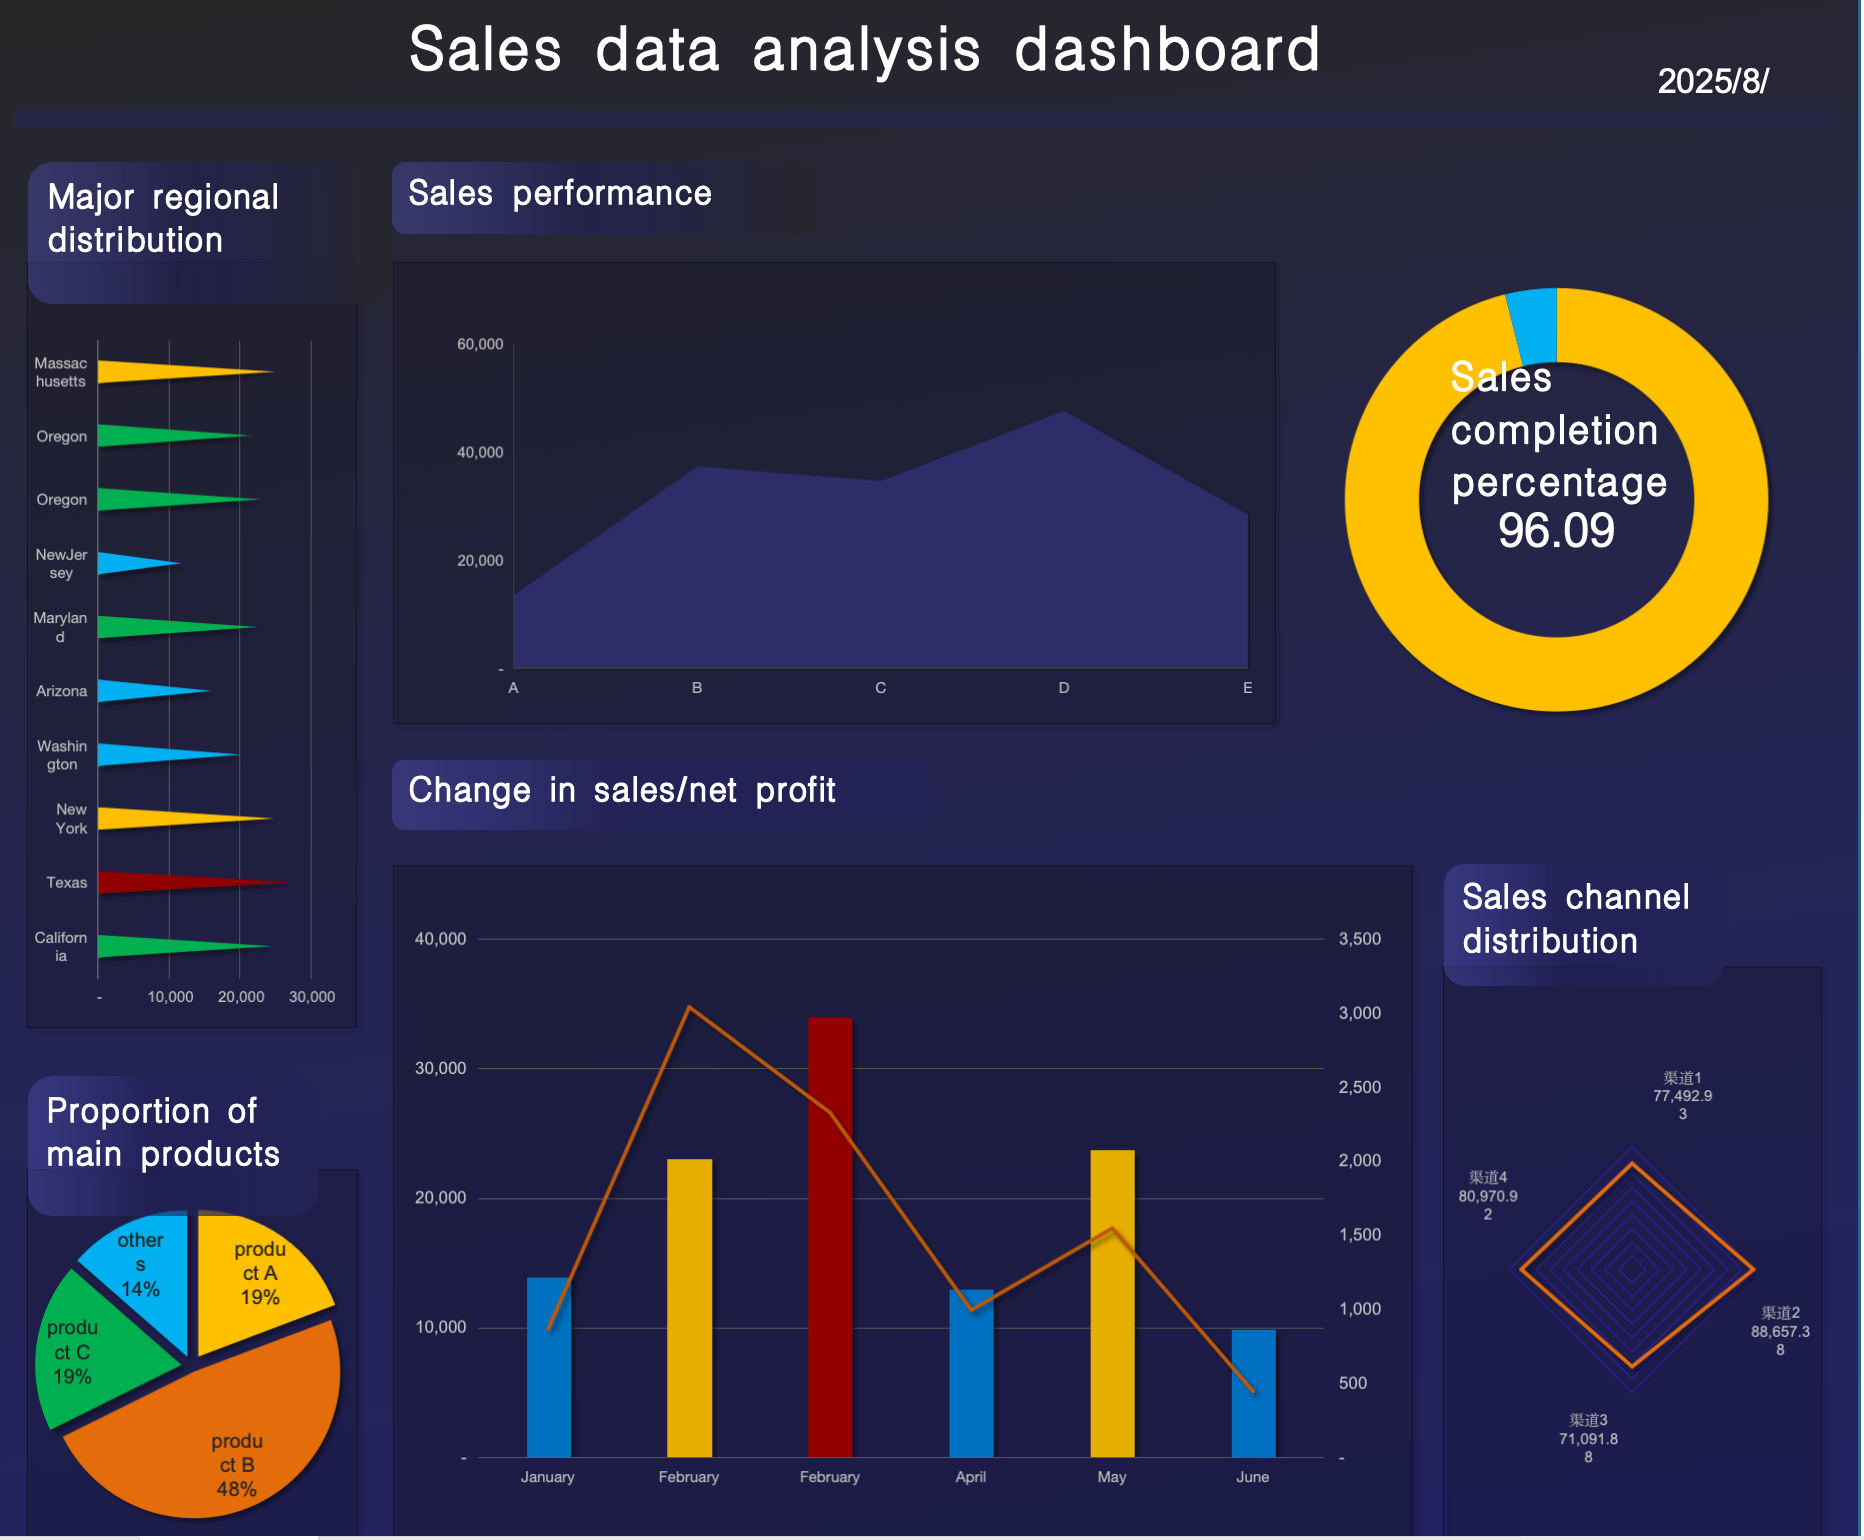
The Sales data analysis dashboard is a premium Excel template designed to help businesses and analysts gain clear insights into their sales performance. This all-in-one dashboard integrates regional data, product distribution, sales completion rate, performance trends, and channel analysis into a single, interactive visual tool.
Whether you’re managing monthly reports or presenting to stakeholders, this template offers clarity, precision, and professional design.
Key Features:
-
Major Regional Distribution Chart – Compare sales across key states
-
Sales Performance Graph – View trends over custom periods
-
Sales Completion Rate Donut Chart – Monitor goal achievement instantly
-
Sales/Net Profit Change Chart – Analyze financial fluctuations over time
-
Product Proportion Pie Chart – Track the performance of core products
-
Sales Channel Radar Chart – Evaluate effectiveness across multiple channels
-
Fully editable Excel format — No external plugins or add-ins required
-
Color-coded visuals with professional dark-themed layout
评价
目前还没有评价